The success of your journal depends on developing a regular
readership, who will become part of your scholarly community, cite your
content in their own work, and tell others about the value of your
publication. To do this, however, they will first need to be able to
find you. This section examines a variety of ways to increase the
“findability‟ of your journal through the use of commercial indexes,
open databases, libraries, the media, professional networks, and
professional recognition.
There are several different standards and identifiers that are
commonly used in academic publishing, and it is important for journal
managers to become familiar with them and the role that they play in the
operation of the journal. Although not exhaustive, this section will
cover the most important ones: ISSN (International Standard Serial
Number), Digital Object Identifier (DOI), and ORCID (Open Researcher and
Contributor ID).
An important way of helping people find your journal, and helping
libraries and other organizations to make it discoverable, is to obtain
an International Standard Serial Number (ISSN). An ISSN is an
eight-digit international standard, which allows for any serial
publication (i.e. any publication that is published on a repeating or
“serial” basis – journal, magazine, etc.), regardless of where it is
published, the medium, language, or frequency of publication. ISSNs are
widely used by libraries, citation indexes, and the publishing industry
to uniquely identify and distinguish journals. They are often more
important than the journal title itself for serials management because
they provide a consistent identifier that helps to disambiguate
like-titled journals.
Many external services, including indexing services such as the Directory of Open Access Journals, require that journals have an ISSN.
An ISSN can be obtained free of charge from a local ISSN Centre. An example of an ISSN application from Library and Archives Canada
ISSNs should be displayed on the journal’s website where it can be
easily located, such as the footer or sidebar. If the publication has
both a print and online edition there is typically one for each. In OJS,
you will be asked to enter your ISSN as part of the Journal Settings.
This is used for metadata purposes and is not shown to readers. To make
the ISSN visible in the journal footer, type it into the footer text
field in the Website Settings. To make the ISSN visible in the sidebar,
create a custom block.
For the final published version of an article (e.g., a PDF galley),
you may also want to include the ISSN, along with the journal name and
DOI (see below), on the final page, in the footer of the PDF, or in
another area of the layout version of the article itself. This is
important, as PDFs can be downloaded, shared via email, and become
disassociated with the journal. You always want to provide an easy and
obvious link back to your journal.
The Digital Object Identifier or DOI is used to individually identify
unique content and its location on the internet. They are typically
applied to journal articles, but can be used for other content types
such as datasets, images, or other supplementary materials added
alongside articles. DOIs are what are called “persistent identifiers” —
so even if the URL (Uniform Resource Locator - in other words, a website
link) for a journal changes, the DOI remains the same and can be used
to locate an article no matter where it moves on the web. DOIs are not
only useful for readers trying to access articles, but are also used
extensively by indexers, aggregators, and repositories, so it is
important to take them seriously when trying to increase the visibility
and impact of your journal.
A DOI consists of a series of characters divided into two parts – a
prefix and a suffix, which are separated by a slash. The prefix uniquely
identifies the registrant (i.e. the publisher) of the title, and the
suffix identifies the specific object.
For example, the article “Health Care Professionals’ Opinions and Expectations of Clinical Pharmacy Services on a Surgical Ward” has the DOI 10.4212/cjhp.v69i6.1606
The “10.” part of the prefix identifies the DOI registry or the
agency that issues the DOI numbers - in this example the agency is
Crossref.
The characters “4212” in the prefix identify the registrant - in this case, the publisher is Multimed.
cjhp.v69i6.1606, the suffix, consists of several different parts, meant to distinguish the particular content.
“cjhp” is an abbreviation for the journal – The Canadian Journal of Hospital Pharmacy.
This is a common feature of DOIs, where a journal will opt to be
identified in a DOI by a standardized journal abbreviation. Multimed
publishes multiple journals, and this helps to identify to which of its
titles this article belongs.
“v69i6.1606” is the volume number of the article (69), then the
issue number (6), and finally “1606” is a unique identifier for the
individual article. For journals using OJS, the DOI will be
automatically generated for each article.
DOIs are capable of identifying a journal, an individual issue or
volume of a journal, an individual article in a journal, or can even go
so granular as to identify a table or chart in a particular article. Not
all journals use an abbreviation as part of the suffix. Many use a
random number that is assigned by a DOI registration agency. However,
using a journal abbreviation is a good way of allowing users to more
quickly identify your journal.
You may often see DOIs communicated as URLs:
“https://dx.doi.org/10.4212/cjhp.v69i6.1606.” This method can be used to
obtain any article that has a DOI, by indicating the DOI following the
“dx.doi.org.”
Journals publishing with OJS will find it very easy to work with
DOIs. However, some initial setup steps are required. First, you will
need to register with Crossref, which does require an annual fee. Further integration regarding OJS’ integration with Crossref can be found in the Crossref manual. You will then need to enable the DOI plugin within the OJS Journal Settings. Using DOIs and the DOI plugin provides you with the detailed steps you need to follow to configure DOIs for OJS.
Once you have joined Crossref and configured OJS to use DOIs, you
will need to register your content as it is published. OJS can be used
to manually deposit DOIs to Crossref, or configured to automatically
deposit DOIs. A step-by-step guide to making DOI deposits to Crossref
can be found in the Crossref manual.
The Open Research and Contributor ID (ORCID) is a persistent digital
identifier that distinguishes one researcher or contributor from
another, and is being increasingly adopted in workflows for grant and
publication submission. The ORCID also serves as a means of ensuring
that a researcher is accurately identified as a contributor for a
particular work. This is particularly useful when authors have the same
names. ORCID also ensures that works are properly attributed to authors
who have undergone a legal name change.
An ORCID can be obtained by any researcher by registering on the ORCID website. Registering for an ORCID is free, and filling out a basic profile takes just a few minutes.
Here’s an example of an ORCID profile: http://orcid.org/0000-0001-6192-8687 for researcher and PKP Director John Willinsky.
ORCID adoption is increasingly becoming a requirement among journal
publishers and funders and many systems are using ORCIDs as a way to
easily integrate author and/or contributor information into online
submission forms. By identifying yourself with your ORCID in filling out
a grant submission or manuscript submission form, the system that
you’re entering can easily pull in all of the information contained in
your ORCID profile into the registration form.
Note
Having a public profile also lends credibility to a
researcher, allowing them to specify their education, employment, as
well as published works in one central location. It also lends
credibility to the journal, such as when you include the ORCID numbers
for each of your editorial team members on your website. It is a
valuable way to demonstrate that there are real people associated with
your journal, not a list of made up names (which is seen as a sign of
being a “predatory” journal).
Journal managers can encourage the use of ORCIDs by authors as a
means of effectively collecting up-to-date information. While it might
not be appropriate to enforce the use of ORCIDs, as not all authors will
have them, it could be suggested to authors that they obtain an ORCID
as part of the submission process and that it be required upon
acceptance. This information, including a link to the ORCID registration
form, could be part of the journal’s submission policy and featured on
the journal’s website.
For journals using OJS, the ORCID can be entered as part of a user profile (under “Public” in OJS 3):
The OJS registration page can also include the option for new users to use their ORCID when registering:
This will automatically pull their personal data (first name, last
name, email, etc.) from the ORCID database into the OJS registration
form.
Despite the existence of specialized research databases, many
researchers begin their online investigation in a search engine, like
Google. Ensuring your journal is well placed within search engine search
results is therefore an important responsibility for journal managers.
Search Engine Optimization (SEO) refers to the process of increasing
the visibility of a website, webpages, or website content (such as your
journal articles) within search engines. SEO is an important
consideration for online journals seeking to draw visitors to their
sites. When a researcher does a search on Google that is relevant to
your subject area, you want your articles to appear as close to the top
of their result list as possible. SEO can help to put you higher on that
list.
Most visits to websites are driven by search engines. Two major
search engines make up more than 95% of all search traffic in the United
States: Google and Yahoo!-Bing alliance. For most countries outside of
the US, over 80% of search traffic comes solely from Google (with some
exceptions, including Russia and China (Fishkin & Moz, 2015).
Search engines provide two important functions: they return results
relevant to the search query and they return results often according to
popularity of the websites. Much of what is written about SEO pertains
to commercially-oriented businesses and organizations seeking the
maximum exposure for their brands and products via search engines. Some
of these organizations have deep pockets and have invested considerable
time, effort, and money on SEO. For those with limited or no budget and
with highly specialized content, there are still some simple steps you
can take to raise your visibility.
While most modern search engines are fairly adept at indexing sites,
there are a number of things that you can do to rank higher in search
engine results and draw more readers to your journal.
Some of the best ways to ensure good SEO are based on more general principles related to modern websites and design:
Make your website easy to use, navigate, and understand
Provide direct, actionable information relevant to a user’s search query
Deliver high quality, legitimate, credible content
Source: (Fishkin & Moz, 2015).
Used appropriately, OJS can help you adhere to these principles,
provide effective SEO for journals, and help you raise your visibility
on the web.
Search engines work by sending out automated “crawlers” across the
web. These “crawlers” need to be able to visit your site and index every
page. Here are some practical steps and considerations you can use in
order to help crawlers index your site:
Search engines have an easier time indexing material that is in
HTML format. For OJS journals, your site is in HTML and will present no
problems for crawlers. Although more resource-intensive, you may wish to
consider publishing HTML versions of your articles, as PDFs are
typically not as indexable. However, keep in mind that steps can be
taken to make PDFs more accessible to search engines. See: 10 Tips to make your PDFs SEO friendly
If you use images on your journal website or in your articles, it
is advisable to use the “alt” attribute to provide search engines with a
text-based description of images. This also improves the overall
accessibility of your journal website, assisting users with screen
readers to understand the contents of an image. For OJS journals, you
can add alt tags for the information you enter as a part of the setup
process.
Similarly, video and audio content is typically not indexed well by
search engines, so providing things like transcripts can go a long way
in making this content more accessible and indexed by search engines, as
well as usable by a broader spectrum of users, such as those with
hearing or visual disabilities.
Another important way to enhance your SEO is by having a modern site that provides a positive user experience:
“Usability and user experience are second order influences on
search engine ranking success. They provide an indirect but measurable
benefit to a site’s external popularity, which the engines can then
interpret as a signal of higher quality. This is called the “no one
likes to link to a crummy site” phenomenon.” (Fishkin & Moz, 2015, p. 27).
For OJS users, designing an appropriate site can be achieved through
the new OJS theming capabilities. In particular, OJS 3 offers
significant improvements when it comes to user experience and usability,
having undergone significant user testing in its development. For
guidance on how to customize the look and feel of the OJS software,
please consult the PKP Theming Guide.
With the rise of social media, the sharing of content of websites
(including academic articles) via social media outlets such as Facebook
and Twitter has also arisen as a factor considered as part of SEO. While
search engines may treat socially shared links differently than other
web content, it is a factor that is taken into consideration when
ranking search results (Fishkin, & Moz, 2015). Google, for example, takes into account different social sharing factors when ranking its search results.
For advice on developing a social media presence for your journal, see the section in this guide on using Social Media for your Journal. Publicizing your publication and its contents through social media will help boost your search engine rankings.
Links aren’t everything in SEO, but search professionals attribute a
large portion of the engines’ algorithms to link-related factors.
Through links, engines can not only analyze the popularity of websites
and pages based on the number and popularity of pages linking to them,
but also metrics like trust, spam, and authority.” (Fishkin, & Moz p.30)
Linking on the web works in two directions: links to your journal,
including to your articles, from other sites, and links you include on
your journal to other sites. Both play an important role in SEO. The
more sites that link to your journal, the more likely your journal is to
rank higher in search engine rankings. Here are some things you can do
to help get more links to your journal:
Hire a professional graphic designer to create a journal logo that others could use to link to your site.
Have other journals, conferences, or associations in your discipline link to your site, in exchange for you linking to them.
Ask your professional association, universities, libraries,
academics working in your discipline, or other related organizations in
your field to provide a link to your site on their web pages.
Get articles from your journal featured (and therefore linked) in a
news story, media release, or blog. Media stories also tend to reach
larger audiences, ensuring that your journal website is noticed by more
readers than usual.
Getting linked to often comes about through letting others know about
your journal, and may not require any additional effort. Be wary of
mass solicitation in attempting to get others to link to your site,
however, as this is often seen as spam and can undermine the credibility
of your journal as well as negatively impact your SEO.
Linking from your journal to other relevant sites is another
important way to increase your SEO. Relevance is key here, as search
engines are smart enough to recognize if you fill your site with
unrelated links in an obvious attempt to raise your SEO illegitimately.
Some simple ways to increase the relevant links on your website include:
Include links to profile pages at the home institutions or professional websites for all of your editorial team and authors. See this example for PKP Director, Dr. John Willinsky.
This not only adds many relevant links to your journal website, but
also significantly boosts its credibility by demonstrating that these
are all real people. A common practice of predatory journals is to make
up editorial board members, or to list people without their knowledge,
so this is a good way to show you are a legitimate journal.
Include links to the ORCIDs of your editorial team and authors.
Similar to the item above, it increases relevant links and increases
your credibility.
Add DOI links to as many items in the references of your articles
as possible. This will further boost both your relevant linking and your
demonstration of being a professional publication. In OJS, this can be
done by adding links to the reference list entries in the PDF galleys,
the HTML galleys, and on the article abstract page.
Create a page for relevant journals, associations, and other
organizations closely associated with your journal. For example the Canadian Journal of Sociology would likely link to the Canadian Sociological Association.
Add a relevant Twitter feed to the homepage or sidebar of your
journal, displaying the latest 5 or 6 links to the latest tweets from a
related hashtag.
One of the easiest ways to determine how your publication might be
faring in search engines is to do some tests for keywords and phrases.
Try searching for your journal name or an article title in a search
engine like Google and see your journal site is being indexed.
There are a wide variety of tools that can assist you with Search
Engine Optimization and can help you understand the traffic for your
website:
Google Webmaster tools and the Google Search Console
can help you understand how your site is performing, and provide many
tools to help improve your search ranking and performance.
Google analytics or Piwik
can help you understand your web traffic. Both have OJS plugins and are
popular, free, and effective ways to understand and report on traffic
to your journal website.
Moz Link Explorer is another tool that allows you to analyze the sites that link to your website.
SEO can be intimidating and take time, practice, and experience to do
properly. But by following some of the advice outlined in this section,
you can take steps towards ensuring that your journal will be highly
visible in the search engines used by researchers interested in your
content and understand the web traffic reaching your website.
Indexes and databases are online, searchable collections of
information. Sometimes they only include metadata (author names, article
titles, subjects, keywords, etc.) and sometimes they contain the
full-text. Some of them are freely available, and some of them require
individual or institutional subscriptions to access. They are typically
curated for relevance and quality and will have some set of criteria for
what is included. For your journal, three important questions to ask
are: is this database relevant to my journal? What are the criteria for
being included? How do I submit my journal’s content?
Indexing services ensure that scholarly content is discoverable and
accessible to the broadest possible audience. It is strategic for a
journal’s content to be visible where researchers in the field are
conducting their research, and this is achievable by targeting indexes
favoured by scholars in a given area of study. This includes any number
of open and commercial indexing services and universal indexes like Google Scholar.
Indexes can broadly be categorized as commercial and open. Both have
their advantages and disadvantages and are explored in further detail in
the sections that follow.
Those seeking maximum exposure for journals are advised to pursue
inclusion in as many indexes as is appropriate and possible. It is
prudent to bear in mind the significant documented advantages of publishing in an open access format in terms of usage and impact. These advantages are magnified by indexing with open indexes.
It is strategic to target indexes for your journal that address the
needs of the scholarly community engaging with your publication. These
vary from one discipline to the next. Journal editors are advised to
consult Ulrichs Web Global Serials Directory,
a commercial service for which institutional libraries may have a
subscription. A common strategy is to look up related journals in your
subject area within Ulrichs and explore their abstracting & indexing
affiliations. This figure shows a tab that be expanded within a
respective journal’s description page within Ulrichs. A screenshot from Ulrichs Web Global Serials Directory
This provides an ideal starting point for identifying services to approach. SPARC also provides a broader list of indexes to consider.
Different indexes will have varying criteria for including your
publication’s content in their index. Depending on the index, the
indexing process may require manual intervention. As an example, regular
exports of metadata from your journal, sometimes in particular formats,
may be required.
Some organizations may provide guidelines and their requirements for
publishers providing content to them. This can include (but is not
limited to):
Delivery mechanism (e.g., via File transfer protocol or web upload)
Acceptable file formats (e.g., PDF, HTML)
Provision of metadata – (e.g., JATS/NLM XML)
Also, bear in mind that some indexes may require that you meet
certain criteria before being included in their indexes, such as
reaching a minimum number of published articles or publishing a certain
category of scholarly outputs (e.g., articles vs. reviews).
In OJS, there are many data export utilities, such as plugins that
export to DOAJ and PubMed, that will facilitate providing some of the
necessary contents and metadata to certain indexes.
Most often, when an independently published publication such as a
journal seeks to partner with a commercial indexing service for
inclusion with a particular commercial database or index, they will
often be presented with a legal agreement.
If at all possible, it is advisable to seek legal counsel, or advice
from those knowledgeable in electronic licensing, to review this
document to ensure that it is in the best interest of your
journal/publication.
Some things to be wary of:
If the commercial index asks for “exclusive” rights to index your
publication, this is problematic. This means that you may not be free to
provide other entities (commercial or noncommercial) with the ability
to index your content. Granting the indexing organization “nonexclusive”
rights is much better because it frees your journal to seek out other
indexing partnerships and not be limited to indexing in just one
database or with one commercial vendor.
The amount of time between the provision of your content to the
vendor (e.g., PDF files and article metadata) may vary from one subject
index to the next. The vendor will typically provide some mechanism for
correction of errors in the guidelines for providing them with content.
It is important to note that commercial products are not Open Access
products. They are designed to provide access to a limited audience, and
as such limit your publication’s exposure. It is important to broaden
one’s indexing strategy beyond commercial indexes and take advantage of
multiple different indexes – both commercial and noncommercial – to seek
the maximum exposure of your journal or publication to a wide variety
of audiences.
Open indexes are similar to commercial indexes in that they aggregate
citation metadata into a single searchable database or listing. The
main types of open indexes include directories and search engines. One
of the principle advantages of open indexes is that they are freely
available online for anyone to use, including individual readers and
libraries.
Many open indexes are also more willing to include content from new
journals, placing more emphasis on the quality of your content and your
open access policy than on a large archive of published material. In
addition, your content can often be included more quickly in open
indexes. Open indexes are becoming increasingly important to
researchers. While they may not yet have the same prestige or influence
as some of the commercial indexes, becoming part of one or more of them
will significantly raise your journal’s profile with a wider audience of
readers.
Like commercial indexes, open indexes are also looking for
high-quality content, peer review, compatible subject matter, and
evidence of stability and sustainability. Some, however, may be willing
to accept submissions from new journals lacking an established history
of publication. If you do not know the best open indexes for your
journal, contact your library. They will be able to guide you in the
appropriate direction.
The Public Knowledge Project Index (PKP Index)
is an openly available database of articles, books, and conference
proceedings based on journals or other publications that use PKP’s Open
Journal Systems (OJS), Open Monograph Press (OMP), and Open Conference
Systems (OCS) software applications. The PKP Index uses the Open
Harvester System (OHS) software and hosts thousands of publications. It
is not subject specific. The PKP Index is a good choice for your first
index and is one way that you can increase the visibility of your
journal.
In order to be included within the PKP Index, your journal must
include at least one published item. Tests, demonstrations, and empty
installations will be rejected. You’ll need to wait until you’ve started
publishing before you can sign up. This will be true of most indexes.
To register for the PKP Index, go to the registration page for the PKP Index, follow the instructions, and ensure that you adhere to the requirements noted on the registration page.
Processing the registration might take a few days to a week or so, as
PKP staff approve the registrations. Check back after a short time, and
click on “Browse” to see an alphabetical listing of all publications
that are included in the PKP Index and you should see your publication
appear. Future issues will be automatically included in the PKP Index;
no further action is required on your part.
The Directory of Open Access Journals (DOAJ)
is an online, community-curated list of open access journals, which
aims to be the starting point for researchers looking for quality
peer-reviewed open access resources. As stated on the DOAJ website: “the
aim of the DOAJ is to increase the visibility and ease of use of open
access scientific and scholarly journals, thereby promoting their
increased usage and impact”(Directory of Open Access Journals [DOAJ], 2018).
The DOAJ’s mission is to increase the visibility, accessibility,
reputation, usage and impact of quality, peer-reviewed, open access
scholarly research journals globally, regardless of discipline,
geography or language.”DOAJ, “Mission” 2018. As of this writing, DOAJ claims to have approximately 11,000+ journals included as part of its index (DOAJ, 2018).
Having your journal included in DOAJ can have significant benefits
for your journal’s reputation, usage, and impact. The DOAJ has
established itself as a key index for high-quality open access journals
worldwide. It is becoming the defacto “white list” of non-predatory open
access journals, so you definitely want to be part of it. Including
your journal in DOAJ will bring significant visibility to your journal –
libraries include DOAJ journals as part of their catalogs, which will
mean that your journal’s content will be included when thousands of
students, faculty, and other researchers are looking for content. DOAJ
is also a very common resource for authors looking for open access
journals to publish in, which will also serve to raise the profile of
your journal and assert its legitimacy. To help authors identify
potential journals for submission by subject, DOAJ includes a “Browse
Subjects” feature.
DOAJ determines quality and acceptance into the directory through an
extensive application process. In March 2014, new criteria guidelines
were established. DOAJ provides guidance for journals for its
application process. Journals may also be removed from the index if they
do not meet DOAJ’s requirements. More information about inclusion and
removal of journals can be found at the DOAJ FAQ list.
For guidance in applying for inclusion in DOAJ, please see [Appendix:
DOAJ]
(https://docs.pkp.sfu.ca/getting-found-staying-found/en/getting-found-appendix-1-DOAJ).
Google Scholar is a search engine for scholarly literature that has
grown quite popular since it launched in 2004. It provides a simple
search interface allowing users to search across many disciplines and
sources for scholarly material such as articles, theses, books,
abstracts, and court opinions and includes material from academic
publishers, professional societies, online repositories, universities,
and other web sites. Google Scholar “About” 2018.
Google scholar is used by many people to access scholarly research,
including researchers themselves, so having your journal included in its
search results can provide great exposure for your journal.
OJS interacts very well with Google Scholar. In fact, Google Scholar recommends OJS as a publishing system for journals seeking to get their articles discovered online. In order to expedite indexing in Google Scholar you can also use Google Webmaster Tools.
Google Scholar has as part of its criteria, that your content feature
primarily scholarly articles. Additionally, at a minimum, the abstracts
will need to be made freely available in order that they may be viewed
in Google Scholar search results.
To be crawled by Google Scholar, the articles that your journal
publishes need to be in either the HTML or PDF format. If publishing in
PDF, the text must be searchable. To configure searchable text in OJS
ensure that the appropriate search settings are enabled in the OJS config.inc.php file. You can read more about this in the Administrator’s Guide.
Google Scholar requires that particular technical specifications be
followed to ensure proper indexing. OJS users can take comfort in the
knowledge that Google Scholar recognizes OJS as meeting its
specifications but should take care to read the indexing guidelines to ensure their content is optimized for inclusion.
PubMed is one of the most recognized and respected open indexes. As
with commercial indexes, PubMed collects metadata from various journals
(all in the field of life sciences and biomedicine) and combines them
into a single searchable database.
Journals in life sciences, medicine, or biomedicine fields that use
the Open Journal Systems platform should endeavour to be included in
PubMed. To facilitate this, OJS includes an exporting tool, which
produces a file of all of your journal’s metadata suitable for sending
directly to PubMed. Some open indexes, such as BioMed Central or
Chemistry Central, only include their own published content. For
journals not published by BioMed Central or Chemistry Central, it is not
an option. Examples of other open indexes include Agricola
from the U.S. National Agriculture Library and
ERIC(https://eric.ed.gov/) sponsored by the U.S. Department of
Education, Institute of Education Sciences. Further reading:Medline journal selection FAQ:Medline online application:PubMed Central FAQ for publishers:PubMed Central online application:
A knowledge base in the context of electronic resource management
refers to a database of metadata about online journals and other online
formats. The information about online journals in a knowledge base is
frequently organized by publisher/provider and lists of related titles
or titles in a product and is used to facilitate user-facing discovery
services such as:
Linking between indexes and content platforms (link resolving)
Maintaining lists of journal titles that are searchable, are browsable, and that link to publisher platform
Populating unified / federated indexes of content for “discovery” by specific communities of users
Knowledge bases and link resolvers, journal title lists, and
discovery tools may be more or less interoperable, and may be open
source projects, but are more frequently developed and maintained by
commercial service providers. In either event, representation of
title-level metadata in a knowledge base is prerequisite to link
resolving, presence in user-facing journal lists, and indexing in
discovery tools such asSummon, EBSCO discovery service, and Primo.
Frequently, participation in open indexes such as the PKP Index or
the DOAJ (as detailed above) will also achieve representation even in
commercial knowledge bases, which often seek to include Open Access
materials as value-added resources. However, the completeness and
currency of open access title lists in knowledge bases varies, and it
may be necessary to contact a knowledge base provider to request
inclusion or an update to a title list that should include a journal but
does not.
Commercial indexes and aggregators are collections of journal
citation details (such as author names, article title, journal title,
volume and issue numbers, abstracts, etc. – also known as “metadata”)
maintained in a central, searchable database. As commercial services,
these indexes are only available with a paid subscription and are often
accessed by readers through their library. Significant portions of many
academic library budgets go toward making these commercial products
freely available to their faculty and students. One of the most
influential indexes is Clarivate Analytics (previously Thomson Reuters) Web of Science.
Some indexes may be focused on a single discipline, such as PsycInfo for psychology, whereas others are multidisciplinary, such as Elsevier’s Scopus.
Some combine information from hundreds of journals, and others may only
include the metadata from a few. Some indexes are produced by scholarly
societies or nonprofit organizations, and others are produced by
for-profit businesses. Commercial indexes are often an important way
for readers to find your content, and getting included in one or more of
them is important for your journal’s success.
How you get journal included in a subject index will vary from one
subject database to the next. It’s possible that your journal may be
approached by commercial index organizations such as ProQuest and EBSCO.
One important consideration is the ownership of intellectual
property. Often, part of the agreements that some commercial
organizations will ask journals to sign will include a clause requiring
that the journals have the rights to be able to grant the right for the
index to include the journal’s content as part of the database. In order
to do this, the journal must have had an appropriate policy that has
assigned the journal the appropriate rights to redistribute this
content. Journal managers may wish to consult the following document,
which provides guidance for working with commercial aggregators.
The actual steps involved to getting material included in commercial
databases will differ. For commercial indexes (and many other indexes)
they will make information available on how to go about getting indexed
as a part of their databases. For example:
Web of Science is another popular commercial index that many journals
wish to get indexed in. Editors will first want to consult the master
journal list to see if the journal is included, and ensure that their
publication is in alignment with the selection criteria. Web of Science Resources
Promoting and marketing your journal to propspective audiences can be
a great way to raise the profile of your journal. There are a variety
of ways to go about this, including via social media, as well as getting
media attention for research that your journal publishes.
Social media is a valuable way to reach specific audiences to
introduce and amplify the work of your journal’s contributors. It can
also supplement your communication with contributors by providing a
channel that acknowledges and promotes their work. Your chosen platform
should apply the established brand of your journal (for example, your
journal’s logo, wordmark, or colours), as this consistency will support
perception of credibility.
While most platforms are available for use without fees, effective
use requires a sustained investment of attention to plan and maintain.
Tools such as Twitter, Facebook, Instagram, etc. can help you target an
audience, but there is huge competition and lots of “noise.”
Building an engaged social media following can absorb as many
resources as you are willing to commit. Your social media plan should
include recruiting the support of those who have already developed a
credible profile and following among the target audience. Social media
management tools bring multiple social media accounts into a single
platform to facilitate scheduling of content, supervising contributors,
and tracking metrics. It is worthwhile to determine your needs and
capacities to select a suitable management tool. Few are free, most are
subscription based. Examples include Hootsuite or Social Pilot.
It is common for scholarly social networking platforms, such as Academia.edu, ResearchGate, or Humanities Commons,
to provide social features to network users by encouraging them to
follow one another and to receive alerts when a followed person
publishes. Educating authors about these features can increase their
findability and also increase visits to your journal.
Your authors and editorial team are the logical “core” of a journal’s
social media team. Useful things they can do to bolster your
publication’s social media presence include the following:
Like, follow and share the content on the journal’s social media platforms.
Follow and promote each other as co-contributors to the journal on
their personal or professional social media accounts. For example,
point to articles published in the same issue of a journal: “Appreciate
the methodology used by Dr. Chao in this article just published in
[Journal Name with URL]”
A member of the editorial team can build and oversee a team of
staff or volunteers to populate your journal’s social media platforms
with content that is vetted before publication. Online management tools
such as Hootsuite can help to streamline this process.
The inverted pyramid style media release remains a valid tool for
getting information to key individuals and organizations about content
published in your journal. The method of delivery has changed, but the
media release is still a valuable way to pitch a story to a reporter who
is almost always a layperson. We may consume media on different
platforms, but commercial or traditional media remain the producers of
trusted content that is shared across new platforms. Videos from TV
news, stories from newspaper websites and blogs, and audio from radio
stations continue to be widely shared on the news media. These
traditional media still confer credibility and reliability to sources.
Reporters and their editors still turn to news releases as a way to
discover stories. With some exceptions, a news story shared on social
media about something in your journal will be perceived with a higher
degree of credibility among a wider (though shallower) audience than if
you simply post a link to the information on your social media platform.
It might be tempting to rely on an article abstract in place of a
media release, but abstracts, regardless of effort to use “plain
language,” perform a different function and are not accessible to a
general audience. The decision to create and use a media release will
depend on your journal’s public profile needs and how important it is
that your contributors’ work is noticed and by whom.
Image source: Air Force Departmental Publishing Office (AFDPO)
[Public domain], via [Wikimedia Commons].
(https://en.wikipedia.org/wiki/Inverted_pyramid_(journalism)-Check)
It is increasingly common that funders require projects to include a
knowledge translation or mobilization component. Getting a story into
the local community paper may or may not fulfill this requirement, but
an article or mention in an industry magazine such as Nature, Aviation Week, or CPA Magazine
might. News reporters rarely spend time researching stories on their
own. They rely on trusted sources. Unless they are assigned to a beat,
which is rare now, most reporters will need explicit guidance to
understand your subject area. Reporters rely on media releases to
understand and shape a story. Media releases point out the relevance of
an article to the media outlet’s audience, position an author as an
expert and invite reporters to connect with the expert. Keep in mind
that reporters may not be able to read the original journal article and
may not have the necessary disciplinary background to interpret it
appropriately.
Factors to consider in developing a news release #
Who is your audience and what do you want them to do? Example: If
your journal is for perfusionists and you want them to subscribe or
read your new journal about perfusion, consider a media release to The
Canadian Society of Clinical Perfusion, not The Globe and Mail
Are you the person who should write the release? An editor may
have the support of an institution’s communications staff who will have
the skill set and contacts to help you get the story out. In this
situation, an editor serves the role of guide and educator to the
communications person who is usually not an expert in your field. The
editor may also be an important go-between with the author(s).
A modern media release can be multi-media, incorporating video, animation, live links and text.
The findings or content of specific articles is much more
interesting than the fact you have published a new issue. So each issue
offers many promotional opportunities as long as each is tailored to
specific audiences.
It may be a better use of resources to recruit others who already
have a following to promote the content in your journal than to devote
resources to building a following from scratch. The support of
influencers who use social media will also help build a journal’s
following.
Social media can amplify your story, but the substantive content
usually resides elsewhere such as a news website, institutional blog, or
your journal’s announcements page.
Journal content can have a long life. Consider promoting articles
published several years earlier, especially if an article can fill an
information vacuum for something current.
Dissemination should be the other 50% of what authors do: being read and having impact will not happen by itself.
Authors can influence discovery and readership through owned media – i.e. their own communication activities.
Earned media – i.e. when influencers write about your work – is key to reaching larger and more diverse audiences.
There is plenty of data for tracking engagement
and use of articles, but it is scattered across multiple tools and
providers and can be misleading or even incorrect.
Listservs can have higher engagement than modern, ‘cool’, social networking tools.
INTRODUCTION
It takes much time and effort to write a paper – but how
much time and effort do authors put in to finding readers? In this case
study, I explain why I decided to devote an equivalent amount of time
and effort into finding and then engaging with my audience. Drawing on
available data for three papers I published in 2017, 2018, and 2019, I
describe how I promoted them, what happened, and what I learned. You
will learn about the Conversion Funnel and how tools like Kudos and
Altmetric can help drive and track your audience through its four
layers: awareness, interest, desire, and action (downloading and
reading). You will learn the difference between owned and earned media
and why finding influencers and riding waves can be so important. I also
identify areas inside the funnel where an author is dependent on
others, lacks control, or where data is missing, each of which makes
influencing the click‐through rate more difficult. The case study ends
with a set of 10 lessons learned.
WHY ACTION IS NEEDED
The urban legend that many academic papers go unread beyond their authors' ‘collegiate bubbles’ (Meho, 2007)
was seemingly validated in 2014 when the World Bank reported that a
third of its own papers were never downloaded (Doemeland & Trevio, 2014).
However, as with most urban legends, the data tells another story. The
World Bank's authors drew on data from a defunct repository and so
missed data from a new one which showed that all reports were downloaded
(C. Rossel, personal communication, May 2014). Ironically, the fuss
that greeted the World Bank paper certainly drove its readership beyond
its authors' bubble: it has been downloaded more than 8,000 times and,
as of 19 April 2019, has an Altmetric score that tops 200. However, an
essential question remains: how can authors boost their audience beyond
their immediate peer group?
Whilst a paywall might be a commonly cited barrier to being read (e.g. O'Brien, 2016),
others exist, such as arcane and foreign language, discoverability, and
even the comparative difficulty in using journals compared with other
media (Waller & Knight, 2012).
Plainly, you can only download what you know exists, so discoverability
must be a primary barrier, especially because paywalls are now
relatively easy to skirt with tools like Unpaywall (https://unpaywall.org/)
able to find free versions of many paywalled articles, and as a last
resort, there is what I like to refer to as the ‘Scottish Service’ (Note:
According to theatrical superstition, speaking the name of
Shakespeare's play Macbeth invites disaster, so thespians refer to it as
the Scottish Play and the lead character as the Scottish King. Rather
than invite disaster on our house, perhaps it would be safer to refer to
SciHub as the Scottish Service (https://en.wikipedia.org/wiki/The_Scottish_Play).) aka, SciHub.
Writing a paper is a significant investment in time (e.g. Margaryan, 2011),
and authors, their employers, and funders will want a return on this
effort. Of authors in the USA, 70% say they want readers beyond their
sub‐discipline, and just under half say they want to be read by
policymakers (Blankstein & Wolff‐Eisenberg, 2019).
So perhaps it is no surprise that some 300,000 scholars – around 10% of
researchers in developed economies (Organisation for Economic
Cooperation and Development[ OECD], 2019) – have created accounts on a tool, Kudos (www.growkudos.com),
which aims to help researchers communicate more effectively about their
work (C. Rapple, personal communication, May 2019). Since January 2018,
39% of those who have registered with Kudos have used its tools to
promote their articles, encouraged perhaps because using Kudos to
promote scholarly papers leads to more attention, and there is evidence
that downloads grow at a rate that is 23% faster than when it is not
used (Erdt, Aung, Aw, Rapple, & Theng, 2017).
However, these are early days, a recent review of using social media to
drive downloads and citations seems to show little effect on these
metrics (Davis, 2019) – but perhaps there are other objectives than simply boosting readership.
Take for example the University of Manchester. The university implements a protocol that uses Kudos, The Conversation (http://theconversation.com/global), and Altmetric (www.altmetric.com),
in addition to other University of Manchester services, to boost access
to its authors' articles and connect its researchers with policymakers
and influencers (UoMLibResearch, 2019).
I work at the OECD, an institution that helps governments
develop policies to improve the lives of their citizens. The help
primarily comes in the form of advice based on the research conducted by
the OECD at the behest of its funders. Plainly, if the OECD's research
findings and knowledge are left unread, the OECD would be failing in its
mission. This is why Angel Gurría, the OECD's Secretary‐General, often
reminds staff that ‘dissemination is the other 50% of what we do’. For
him, simply doing the research and sharing the results with governments
and funders is not enough; to fulfil its mission, the OECD needs to win
its fair share (or more!) of an ever‐larger audience's attention. This
is captured by the OECD's Publishing Policy in the form of a simple
objective: to ‘maximize dissemination’.
So, when I turned my hand to being an author, I thought I
would follow our Secretary‐General's injunction and spend as much time
promoting my articles as I had spent researching and writing them: to
see if I could maximize dissemination. This is my story of the ‘other
50% of being an author’, my story on trying to find readers beyond my
bubble.
HOW TO ENGAGE YOUR AUDIENCE
The other 50%: Preparation
Just as there are tools and techniques to make writing easier, so are there tools (e.g. Kudos, Altmetric, Plum Analytics (https://plumanalytics.com/), and various social media channels) and techniques (e.g. a conversion funnel) for boosting readership.
Kudos was developed to help researchers promote their
publications and track their efforts in doing so. It invites authors to
create a shareable summary ‘publications page’, where the work's core
messages are presented in a non‐technical way along with a link to the
original work on the publisher's website. (Kudos calls this a
‘publications page’, but I will refer to it as the article summary page
to distinguish it from the article landing page on the publisher's
website that hosts the actual publication.) It offers tools that enable
authors to create tagged links that can be embedded in ‘owned media’
messages and content (see Box 1
for definition). A dashboard gives daily reports on the number of times
the tagged links send traffic to the Kudos‐hosted article summary page,
so the success of each owned media effort can be assessed. The
dashboard also displays the publication's Altmetric ‘doughnut’, which
leads to its detailed Altmetric dashboard.
BOX 1. Owned, earned, and paid media
Owned media is when you post content on
communication channels that are under your control. These could be
websites, blogs, social media, or email.
Earned media is when other people (often known as
‘influencers’) are talking about your work on their websites, social
media, and other channels. It includes traditional or mainstream media
and things like letters to the editor, book reviews, and citations, as
well as word of mouth (e.g. mentions at conferences).
Paid media is when you pay to have your work
advertised in both traditional and online media. This would include
promoted items on social media channels and in search results.
Altmetric is a tool that enables researchers to track the reach and influence of their publications in ‘earned media’ (see Box 1),
specifically mainstream media, on social media, blogs and websites, in
reference management tools, Wikipedia, and in policy documents. Those
with access to its premium features can track citations in journals and
dig back through a publication's impact history. It works in almost real
time, so it gives an author the chance to join in online conversations
that they might otherwise have missed, for example, Twitter threads and
blog postings.
Using both tools together meant that I could track the
impact of my own promotion efforts and see where one of my papers was
being talked about by my audience. The latter was important in helping
me to engage with my readers, to discover and join in conversations with
people who had actually read my papers.
Funnelling conversions to drive readership
The Purchase Funnel (https://en.wikipedia.org/wiki/Purchase_funnel)
is a long‐established marketing principle. Originally coined in 1898 by
E. St. Elmo Lewis, it comprises four steps to making a sale: awareness,
interest, desire, and action. Being an analogue process, its lack of
reliable, affordable, data points brought about that oft‐quoted
marketer's quip about not knowing which half of one's advertising spend
is wasted (Bullmore, 2013).
The arrival of e‐commerce, with its extensive digital
exhaust, meant that the number of people clicking from one step to the
next could be tracked cheaply and easily, and the ‘conversion rate’ (the
percentage of people clicking from one funnel step to the next) could
be calculated. Access to these data has revolutionized marketing, and
any good marketer will now know the return on every advertising dollar
spent. However, as an online marketers' objective is not always a sale
(they might be after your vote), the digital funnel is known as the
Conversion Funnel (https://en.wikipedia.org/wiki/Conversion_funnel).
For an author in scholcom, the objective is to be read
(and, probably, cited), so this forms the lower, ‘action’, part of the
funnel. To get there, a reader must first be made aware that an article exists through search, owned, and earned media and have their interest stimulated by a summary page or abstract such that they desire to seek the full text and act by downloading and reading the work (Fig. 1).
Not everyone will pass right through the funnel; a percentage will be
lost at every step. So, maximizing dissemination requires boosting the
number being introduced at the top and, using traffic data, removing
frictions to reduce the drop‐out percentages at each step through the
funnel.
Conversion funnel – formally published journal article with summary page.
Source: Author's illustration.
Understanding and exploiting the Conversion Funnel is fundamental to any promotion strategy designed to boost readership:
Search is not just how findable your content
is to general search engines; it is dependent on the way your
publisher, and partners such as Kudos or ResearchGate, prepare and
present your content on and to academic discovery services (where a
majority of scholarly searches take place; Blankstein &
Wolff‐Eisenberg, 2019).
The best way authors can boost their chances of appearing in search
results is to post a variety of outputs (e.g. video, slides, blog posts)
with simple, engaging titles in addition to the formal work. Your
article's title should be clear and to the point, and all relevant
keywords should be woven into its abstract.
Owned media is in the hands of the author
(and potentially their employer, funder, or other partner) and should be
used in the long run to drive awareness among the author's own network.
This is where the author has the most leeway to act in the pursuit of
readers.
Earned media can be leveraged by asking
colleagues to send messages via their social media accounts but comes
into its own when ‘influencers’ choose to review, comment, react,
mention, and cite a published work and/or its author. Authors can seek
out influencers, especially those beyond their own bubble, for example
by sending out a press release.
A web page summarizing the article (ideally
presented in an accessible and non‐technical way) could be hosted on the
author's personal, departmental, and/or institution website; on the
author's page on collaboration networks like ResearchGate or LinkedIn;
and on the summary page of tools such as Kudos. To maximize
discoverability, an author would use all of these places. The objective
is to pique the interest of the visitor, to create the desire to go to
the publication's landing page on the publisher website.
The publication landing page will display
the title and abstract of the work, but it could also show key
illustrations and other elements of the work that encourage and
stimulate the visitor to act – to hit the download button. Authors have
little ability to act here because this page is usually under the
control of the publisher or repository owner.
The final, ‘action’, step is to download and read the work,
which could lead to further acts such as saving a publication's details
on reference and citation management tools such as Mendeley and,
looping back to ‘earned media’, citation and sharing among colleagues.
MY STORY
Round one: ‘We've failed’
My first article drew on data to show that the proportion
of born‐open journal articles had stalled at around 20%, leading me to
conclude that the dominant open access models, Gold and Green, had
failed, and therefore, a new approach was needed (Green, 2017a).
It was published in time for 2017s early autumn event season that
comprised ALPSP Conference, COASP, STM Annual Conference, and Open
Access Week. The timing was important because I wanted to use these
events not only to promote the article but to engage with its intended
audience: publishers and librarians.
On publication, I posted announcements on my Facebook
page (where, at the time, I had about 150 friends), Twitter (~600
followers), and LinkedIn (~400 connections). The result, 72
click‐throughs. I also posted an announcement to two Listservs,
generating 1,422 click‐throughs. Over the next 15 days, a period that
included both the ALPSP and the COASP Conferences, I made 12 more ‘owned
media’ promotional efforts: 10 using Twitter and 1 each on Facebook and
LinkedIn. Most of the earned media was on Twitter, where more than 500
different people tweeted about the paper (see Fig. 2).
This was an impressive volume, and many were researchers who exist
outside my bubble (publishers, their suppliers, and librarians).
Number of tweets per day 7–22nd September 2017. Weekends shaded in grey.
Source: Altmetric.
The launch day (L+0) spike tailed off on L+1, a Friday,
but picked up over the weekend and was sustained on L+5 and L+6 but then
tailed off as soon as the ALPSP Conference started. Was my audience
otherwise engaged and too busy to tweet? Or had the discussion exhausted
itself already? All I can report is that a majority of ALPSP attendees
that I spoke with had not heard of the paper, illustrating how hard it
is to gain the attention of one's target audience even with the help of
social media.
To my surprise, it all kicked off again on L+9 (Saturday
16th) with more than 100 tweets because an influencer, ‘mathgenius’,
posted the article title and a link on Hacker News (HN, https://news.ycombinator.com/item?id=15265507),
which in turn was featured on HN's front page, triggering an automatic
tweet to HN's 906 followers. This was re‐tweeted 30 times, including by
various other HN bots, one of which had >20,000 followers. Midway
through L+9, a tweet first posted on L+2 by Jon Tennent got a second
wind and, together with the HN audience, drove the ‘conversation’
through the weekend. A fair proportion of the tweets contained comments
or snippets from the article showing that the paper was being read, and
it was not just a bunch of bots chatting to each other.
The spike on L+13, midway through the COASP meeting, was
the result of my re‐tweeting an image that I found circulating that day
on Twitter (Fig. 3).
I linked the image to my article and, in an attempt to reach the COASP
audience (I did not attend the meeting), added the meeting's hashtag.
This tweet had 17,892 impressions, 42 re‐tweets, and 84 likes, and the
trackable link to the Kudos publication page was clicked 166 times.
Image I found on Twitter and re‐tweeted with a link to my article and hashtagged to COASP Conference.
In addition to all the action on Twitter, Altmetric
logged one blog post (Retraction Watch's Weekend Reads), seven mentions
on Facebook, 19 Google+ posts, and three Reddit posts – none of which,
apart from one on Facebook, were initiated by me. Incidentally, I am
only able to piece together this story of what happened thanks to the
earned media history captured and stored by Altmetric.
Over the next 8 months, I continued to promote the
article, mainly using Twitter, each time using a trackable link from
Kudos – each effort is shown with an ‘A’ in Fig. 4. After the launch month's high click‐through rate (CTR) (Table 1),
the CTR fluctuated, with the next highest being in January, 5 months
after publication. I also uploaded the Kudos‐created summary page in PDF
form onto ResearchGate, where it has been viewed 753 times.
Altmetric score since publication of ‘We've Failed’ article (Green 2017a).
Source: Kudos and Altmetric.
Table 1.
Efforts and click‐throughs
Month
Efforts
Click‐throughs
Click‐throughs per effort
September 2017
22
2,278
104
October 2017
9
222
25
November 2017
2
64
32
December 2017
2
4
2
January 2018
1
275
275
February 2018
4
220
55
March 2018
1
7
7
April 2018
3
33
11
May 2018
1
0
0
Source: Kudos.
It is all very well being able to see who has been
tweeting about my article and to get anecdotal feedback at conferences
and from the occasional personal email, but what I really wanted was to
know how often my article was being downloaded and by whom (or at least
know at which institutions my readers work or study). Knowing where and
by whom my article was being read would give me insight into where I
might be having an impact and, crucially, where I was not being heard.
As I had learned at the OECD, knowing this would help me learn more
about my actual readership and help me target future promotion efforts
to greater effect.
At OECD, we share download data with authors, and it
usually confirms prejudices and produces surprises in equal measure. For
example, I will not be breaking any confidences by revealing that
European Union and United Nations institutions have a healthy appetite
for OECD publications and datasets. But who would have thought that one
country's army officer training school cannot get enough of OECD's works
on education policy and the comparative performances of 15‐year‐olds at
school? This latter data point prompted our education department to
find out why resulting in an unknown unknown becoming a new connection.
So, download data are invaluable yet, as I was to discover, hard to get.
Even though Kudos is set up to integrate download data,
few publishers are able to export per‐article, per‐day usage data, and
unfortunately Wiley, Learned Publishing's publisher, was not one
of them. I had to request the data from the editor who obtained it from
the publisher to discover that, by the end of September 2017, the
article had been downloaded an astonishing 69,148 times. (This
counter‐compliant data point was double‐checked to ensure it had not
been distorted by bots.) In October, it was downloaded 1,834 times, in
November 967 times, and at an average of 315 times a month from then on
to the end of 2018. All I could get was the totals; I was unable to get
any data on which institutions or even which countries were reading my
article, and I had to wait until the middle of the next month to get
last month's data – hardly real time and no help when it came to
planning future promotion efforts.
Round two: ‘We're still failing’
A year later, I began to wonder if there had been any
progress to overcome the failure to deliver open access. A cursory
glance showed that nothing had changed: the needle showing the
proportion of born‐open articles had not moved, so I reached again for
my keyboard. This time, thinking on why the needle was stuck led me to
conclude that scholarly publishing was unaffordable whether done on an
open access or subscription basis. I suggested that lessons from digital
transformation be drawn upon to reduce costs and proposed a two‐step
process whereby scholars would first publish a preprint, and then,
providing the preprint gained attention, the author would be invited to
submit a paper for formal publication.
In order to be faithful to this proposition, I posted the
paper as a preprint on the Zenodo platform on 6th September 2018, once
again aiming for the autumn event season (Green, 2018).
In order to help readers funnel back to the original
paper (and in addition to the usual citation link in the references), I
added a tagged link in the preprint's abstract that would take readers
to the Kudos‐hosted summary page of the 2017 paper. By the end of April
2019, this link had been clicked 429 times, which is 8% of all visitors
to the preprint landing page.
Unfortunately, Zenodo's DOIs could not be integrated with
the Kudos platform, so I could not use it to promote the preprint.
However, Zenodo did integrate with Altmetric, so I can report on the
preprint's owned and earned Twitter coverage (Fig. 5).
Tweets per day for the preprint recorded by Altmetric.
Source: Altmetric (Note that the x‐axis scale is very different to Fig. 2.).
This time, I had to work harder to gain attention: 36 of
the 136 tweets (26%) over the launch period were mine (compared to 14 of
565 – 2.5% – the year before). My persistence was rewarded: for
example, my three tweets during the COASP meeting triggered 20
re‐tweets. However, at an average of 9 tweets per day, attention was
markedly down compared with the 35 tweets per day for the paper
published a year earlier: the influencer ‘mathgenius’ did not come to my
aid this time.
I did not keep a monthly record of the downloads
(displayed in real time on the Zenodo platform), but at the end of April
2019, the preprint had had 5,426 views and 1,796 downloads, and
recently, the count has been growing at about 300 and 150 per month,
respectively. However, as before, the download data have no detail: my
readers, their institutions, and their whereabouts remain unknown to me.
However, one of my objectives during this launch period
was to ask for comment and feedback on the preprint, so I could improve
the final paper. Within a month, I received substantive input from a
dozen individuals, including two who corrected errors: this I considered
to be a success.
Round three: Is open access affordable?
When I was writing the preprint, I was in contact with the editor of Learned Publishing,
Pippa Smart, where the first paper was published. As she was not put
off by the reaction to the preprint, I submitted a revised version to
the journal in October 2018. It went through the usual peer review and
acceptance process and was published on 25th January 2019 as part of a
special issue ‘Bring the Facts, Bust the Myths’ (Green, 2019a).
As with the preprint, I had to work hard to win attention
on Twitter, creating 29 out of the 146 tweets that mentioned the paper
(Fig. 6),
but with the launch period falling between two of the winter
conferences (APE 2019 was in mid‐January and R2R was in late‐February), I
was unable to generate much momentum after L+9 (2nd February).
Number of tweets per day for 25th January to 9th February 2019. Weekends shaded in grey.
Source: Altmetric.
Between January and May 2019, I promoted the paper on two
Listservs, generating 497 click‐throughs, LinkedIn (48) and
ResearchGate (14); tweeted 35 times (846); wrote two blog posts (88);
and commented on two other blog posts (48).
Downloads of my article for January to April totalled 4,015 (Fig. 7,
Article A). It is interesting to note that the ‘half‐life’ of my paper
seems a little longer than the other two most‐popular papers, but
Article D is unusual in building audience month by month.
Downloads (January to April 2019) per article for the first issue of Learned Publishing in 2019. My article is A. Note: The entire issue is free to download by anyone throughout 2019.
Source: Wiley/Learned Publishing.
Riding waves
One of the techniques I used to promote my articles is
called ‘Riding the wave’. Essentially, one keeps an eye open for events,
industry discussions, public statements, and social media conversations
with which one can engage and draw attention to a paper.
For example, in early 2017, Elsevier published a suggestion about how to work toward open access (Hersh, 2017),
which triggered a fair degree of comment on Listservs and the
Twittersphere. I posted a reply in the form of a blog post on Medium in
which I included a tagged link to my paper (Green, 2017b).
I then drew attention to the blog post using Twitter and LinkedIn,
attracting 1,400 reads from which there were 310 click‐throughs to the
Kudos‐hosted summary page – a click‐through response rate of 22%.
Another example was the invitation for formal responses to Plan S. I posted my response as a blog post (Green, 2019b)
and included tagged links to both papers' Kudos‐hosted summary pages. I
drew attention to the post through Twitter and LinkedIn, and this
effort resulted in 54 readers clicking through to the first paper's
summary page and 72 to the latter.
Most of my wave riding has been on Twitter where I use
one of two techniques: attract the attention of conference delegates by
using conference hashtags or join conversations by replying to suitable
tweets, in both cases using tagged links so I can track the result.
Five wave‐riding efforts that involved more than just ad hoc use of Twitter are summarized in Table 2.
Each effort contained messages from the paper, so even if readers did
not click through, a message was transmitted. It is interesting to note
that it is still possible to generate a worthwhile click‐through and
response rate many months post‐publication.
Table 2.
Summary of efforts (excluding individual tweets)
Timing
Context
Effort
Channel
Result
CT
RR
Paper 1
L+20
Elsevier proposition ‘working toward OA’
Reply to Elsevier
Medium
1,400 reads
310
22%
L+47
Invitation
Pushmi‐Pullyu
LSE Impact Blog
‘Most‐read listing’
67
n/a
L+143
J of Infomatics Board ‘mutinies’
Are mutinies effective?
Medium
610 reads
13
2%
L+153
Plan S Response deadline
My response to Plan S
Medium
611 reads
54
9%
Preprint
L+46
Invitation
Fail Fast
LSE Impact Blog
‘Most‐read listing’
?
n/a
Paper 2
L+2
J of Infomatics Board ‘mutinies’
Are mutinies effective?
Medium
610 reads
55
9%
L+15
Plan S Response deadline
My response to Plan S
Medium
611 reads
72
12%
L+96
BBC Radio 4 Programme on OA
Replies to 6 Tweets
Twitter
334 impressions
28
8%
Source: Kudos, Medium, and LSE Impact Blog.
Timing is days post‐launch. CT, click‐throughs to Kudos publication page; RR, response rate (CT/result).
DISCUSSION
Data everywhere but not a drop to drink
We know that our digital environment generates a firehose
of data. Yet, for authors in scholarly communications, data are hard to
come by. Unlike e‐commerce, where marketers create effective funnels
with vertically integrated digital platforms, a scholarly author has to
try and construct a Conversion Funnel from poorly‐ or unconnected
platforms and tools, many of which will not or cannot share their data
(see Fig. 8).
Conversion funnel showing data sources and availability.
Source: Author's illustration.
For my two formally published articles, I was able to
access data from my owned social media accounts and, thanks to
Altmetric, some earned media channels (e.g. Tweets written by other
people). Kudos could give me data about click‐through rates on my tagged
messages, traffic volumes to the summary page they host, and
click‐throughs to the publisher page.
For example, for the first paper, as I write this, Kudos
has logged 3,694 clicks from the 64 tagged promotion efforts I have made
via owned media channels, 6,299 views of the summary page hosted by
Kudos, and 878 clicks on the button that leads from that page to the
article's landing page on the publisher website. That latter step from
summary page to article landing page is a 14% click‐through rate – or to
put it another way, only 14% of summary page viewers were sufficiently
interested to have the desire to click through to the article.
However, this is where the data chain breaks: I have no
way of knowing how many of those who arrived on the article landing page
were actioned to download the paper. All I know is that more than
70,000 downloads have been recorded, but I am none the wiser about the
share that came from search and my own efforts or from earned media, nor
do I know anything about them, not even where they are located.
That the number of visitors to the Kudos‐hosted summary
page (6,299) exceeds the number of clicks on tagged links (3,694) shows
that the summary page is getting traffic from search and earned media –
but I do not know how much from either nor have access to any logfile
data that could help me understand more.
When it comes to citations, I get conflicting data. As I
write, Kudos tells me the first paper has nine ‘CrossRef citations’ yet
confusingly invites me to view them on Google Scholar, where I find a
list of 10 citing works above which is the metadata for my article and
the message ‘cited by 14’. Meanwhile, Altmetric shows eight citations
(sourcing the data from its sister company, Dimensions). The article
homepage on the publisher site shows seven citations. Confused? You will
be.
De‐duping these records to arrive at a clean,
comprehensive list of where my paper has been cited would not be easy –
none of the sites offers a data feed or downloadable file. Nor do any of
these tools offer alerts when new citations are found: for this, I have
to rely on services like ResearchGate (which, incidentally, reports 14
citations).
A simple data feed from Kudos and Altmetric would have
made it easier to create the charts in this paper – I had to type the
data into a spreadsheet. Altmetric's premium customers can download the
data for their publications, but you have to learn where the link is –
something I only discovered when doing a final edit for this article!
The data from Wiley arrived as a table in a word‐processing document and
I had to spend time copy–pasting into a spreadsheet before I could
chart it.
LICENCES AND REUSE: A CAUTIONARY TALE
As a favour, OECD once published a book for a
resource‐strapped fellow IGO. They insisted the work be published using a
CC‐BY licence. Six months post‐publication, the authors and IGO asked
OECD to issue a commercial distributor with a take‐down notice not
because the distributor was offering a version for sale but because it
was a crudely produced e‐book that, in their opinion, could damage their
reputation. The distributor had found the e‐book online and had
probably used some sort of automated process to strip the (copyrighted)
artist images from the cover and inside pages and re‐cast the work in a
new format: the result was anything but professional (a dog's breakfast
came to mind). To the frustration of the authors and IGO, I had to
explain that there was nothing to be done; the distributor had not
contravened any of the rules of a CC‐BY licence.
I tell this story because CC licences cut two ways when it
comes to boosting dissemination and impact. Yes, others may well expose
your work to audiences beyond your reach, but there are two issues to
consider.
First, there is the issue of reputation risk described
above. This can be mitigated by adding ND (non‐derivative) to a CC
licence, requiring disseminators to stick with your version of the work.
Second, and this is harder to overcome, unless you work
closely with your disseminators, you will have no idea who is re‐posting
your work, if your work has reached a larger audience, or – indeed – if
you are losing traffic and citations to alternative versions. In a
world where funders are demanding impact reports from their fundees,
getting access to all the download and citation data and knowing where
your work has made a mark is going to be more and more important. At
OECD, we encourage disseminators to use our shareable and embeddable
editions because they are trackable: we can see when they have been
embedded in websites and blogs and can monitor how often they are viewed
there, and we can offer users a route to the fully downloadable and
actionable editions on our website.
Working with partners to reach a broader audience is important, but keep an eye on your reputation and get the usage data.
LESSONS LEARNED
Be strategic. Find and use a toolkit that will create a Conversion Funnel to build awareness and draw users through the interest, desire, and action steps. If possible, aim to publish just ahead of a series of events at which the paper can be promoted. (Note:
I know that this will be a major challenge for most journals because
they have such long and unpredictable production times and lack tools to
plan releases. This is a major issue in journal publishing and one that
publishers should be working to fix!) Choose your redistributors with
care.
Be data‐driven. Log, measure, and track your
audience's progress through the Conversion Funnel. Measure your owned
media promotion efforts, so you can find out what works and what does
not.
Be reactive. Use tools that report results of
owned and earned media in real‐ or near‐real time. This will enable you
to shape future promotion efforts around what is working and to engage
with online conversations when they are happening. This is particularly
important on Twitter and other social media sites where discussions and
threads have short half‐lives.
Listservs rock. They might predate the internet, but postings to Listservs had a higher response rate than any other channel.
Reaching your target audience is hard: be active, be persistent.
Even if your target audience is well‐defined and easy to target,
winning their attention is hard because everyone is inundated with new
information every day. So, do not be afraid to keep on going on. To
avoid boredom and stimulate reaction, vary your message and tone. Use
illustrations. Be opportunistic: if you suddenly discover there is an
event going on, use the conference hashtag to follow it and jump in if
you get the chance; if there is a new industry debate catching your
target audience's attention, write a blog post (complete with tagged
links to the article) and draw attention to that. Be active: do not be
like one of the 80% on ResearchGate who just lurk (Khvatova &
Dushina, 2019).
Find influencers. As I found with the first
paper, someone influential can take your message to a wholly new
audience that is way beyond your own bubble. You might only have a
couple of hundred followers on Twitter, but you might know someone who
has a thousand or more. If you cannot approach them directly, wait until
they post something relevant and reply intelligently. If they have a
blog, watch what they write and then comment, with tagged links, when
you can. If your work might interest a broader public, do not hesitate
to contact journalists; earned mainstream media can reach way beyond
your own bubble and reach important audiences like policymakers and
concerned citizens.
Be creative. Do not post ‘read my article’
messages. Post snippets that inform, pique curiosity, or contribute to
debate. If possible, use illustrations that inform or entertain. Have a
clear call to action, such as inviting comment and feedback or that
leads to the next step in the Conversion Funnel.
Keep going. Unless your work is really out of
date, keep promoting it because there are always new audiences or new
contexts that make your work relevant, even months post‐publication.
Hassle your publisher for download data. Until
publishers make download data publicly accessible in real time,
regularly ask for it with as much detail as possible (where, when, who,
etc.).
It is less work than it seems. During the
2‐week launch period, I found I was scanning Twitter and other social
media channels perhaps four or five times a day (for a total of perhaps
30 min a day) and spending perhaps another 30 min creating new tweets
and replying/engaging with conversations on earned media. Afterwards, I
dialled back the effort to my normal scanning level with the occasional
burst of effort to write a blog post when needed. I am sure it never
amounted to the other 50% of my day – I'm sure I spent longer
researching and writing the original papers – but the results in terms
of readership and impact are, I am sure, better than if I had simply
published and passively left it to search engines to find my audience.
ACKNOWLEDGEMENTS
Each of the three articles cited in this case study are free
to download. I must thank ALPSP and Wiley, respectively owner and
publisher of Learned Publishing, and Zenodo, funded by CERN, for
publishing my articles on a free‐to‐read and download basis. I also
thank Kudos' Charlie Rapple for prompting me to write this paper.
Biography
T. Green
REFERENCES
Blankstein, M., & Wolff‐Eisenberg, C. (2019, 12 April). Ithaka S+R US Faculty Survey 2018 [Web log post]. Retrieved from https://doi.org/10.18665/sr.311199
Doemeland, D. & Trevio, J. (2014, May). Which world bank reports are widely read? (World Bank Policy Research Working Paper No. 6851). World Bank OKR [Web log post]. Retrieved from http://hdl.handle.net/10986/18346
Erdt, M., Aung, H., Aw, A., Rapple, C., & Theng, Y.‐L. (2017). Analysing researchers' outreach efforts and the association with publication metrics: A case study of kudos. PLoS One, 12( 8), e0183217. https://doi.org/10.1371/journal.pone.0183217
Green, T. (2017a). We've failed: Pirate black open access is trumping green and gold and we must change our approach. Learned Publishing, 30, 325– 329. https://doi.org/10.1002/leap.1116
Green, T. (2018). We're
still failing to deliver open access and solve the serials crisis: To
succeed we need a digital transformation of scholarly communication
using internet‐era principles. Zenodo. http://doi.org/10.5281/zenodo.1410000
Green, T. (2019a). Is
open access affordable? Why current models do not work and why we need
internet‐era transformation of scholarly communications. Learned Publishing, 32, 13– 25. https://doi.org/10.1002/leap.1219
Khvatova, T., & Dushina, S. (2019). Scientific online communication: The strategic landscape of ResearchGate users. Retrieved from https://doi.org/10.13140/RG.2.2.18535.09122
Organisation for Economic Cooperation and Development. (2019, 15 May). Main Science and Technology Indicators. OECD Science, Technology and R&D Statistics (database). Retrieved from https://doi.org/10.1787/data-00182-en
UoMLibResearch – University of Manchester Library Research Service. (2019). “Here at @UoMLibrary we're serious about supporting #OpenAccess to research …”. (Thread 1/26). Twitter [Web log post]. Retrieved from https://twitter.com/UoMLibResearch/status/1125770884214607872
Waller, R., & Knight, P. (2012). Overcoming barriers to the use of journal articles within the geosciences. Planet, 25( 1), 27– 32. https://doi.org/10.11120/plan.2012.00250027

 An example of an ISSN application from Library and Archives Canada
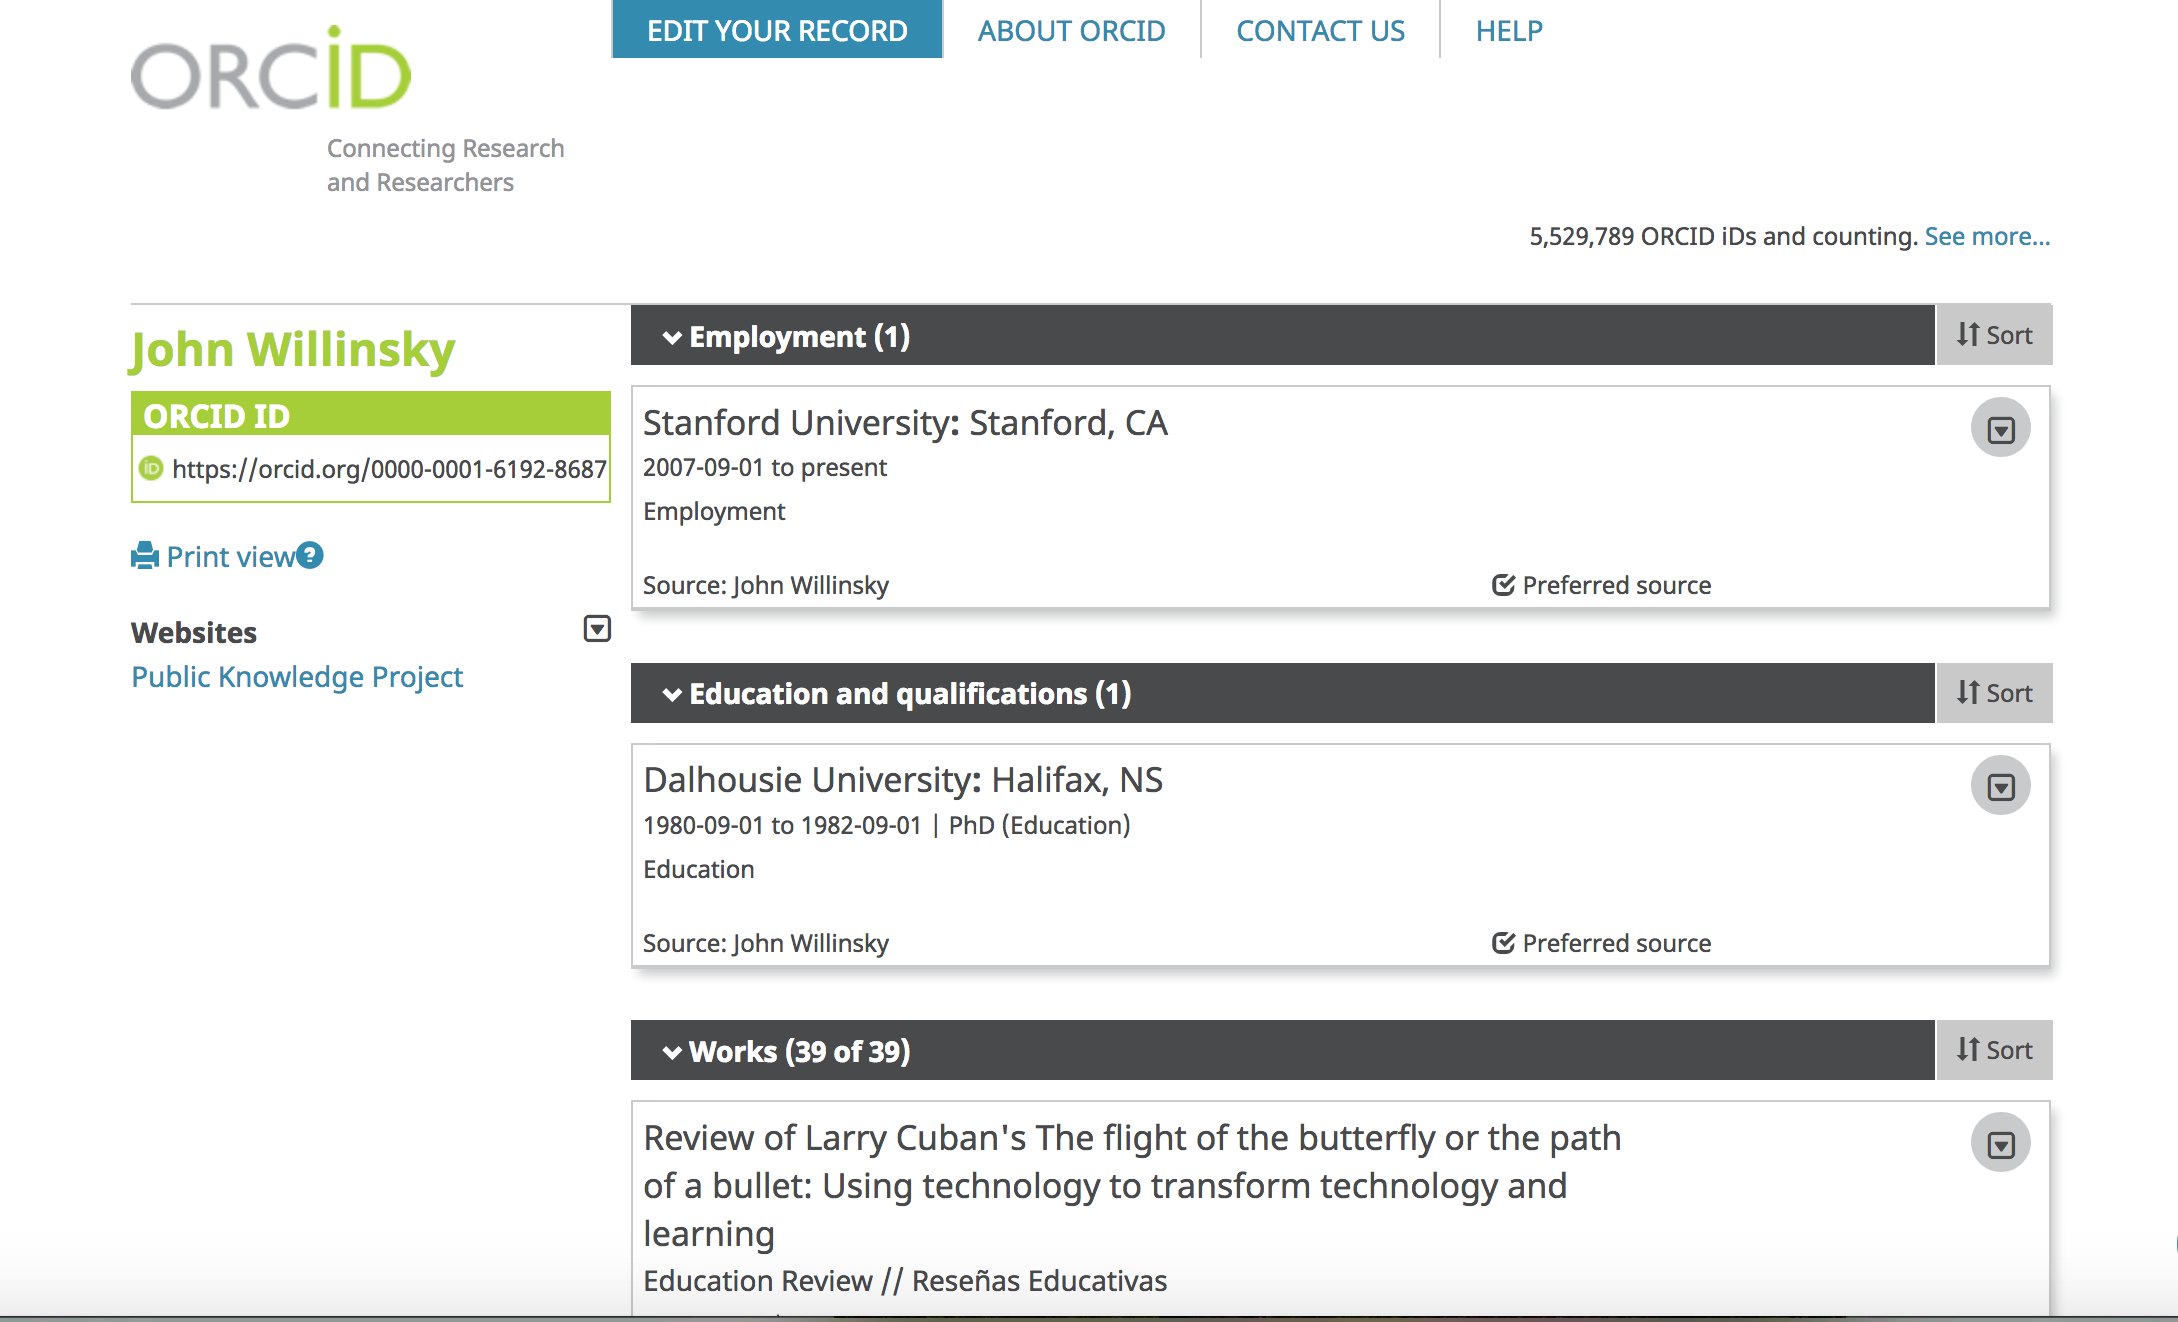
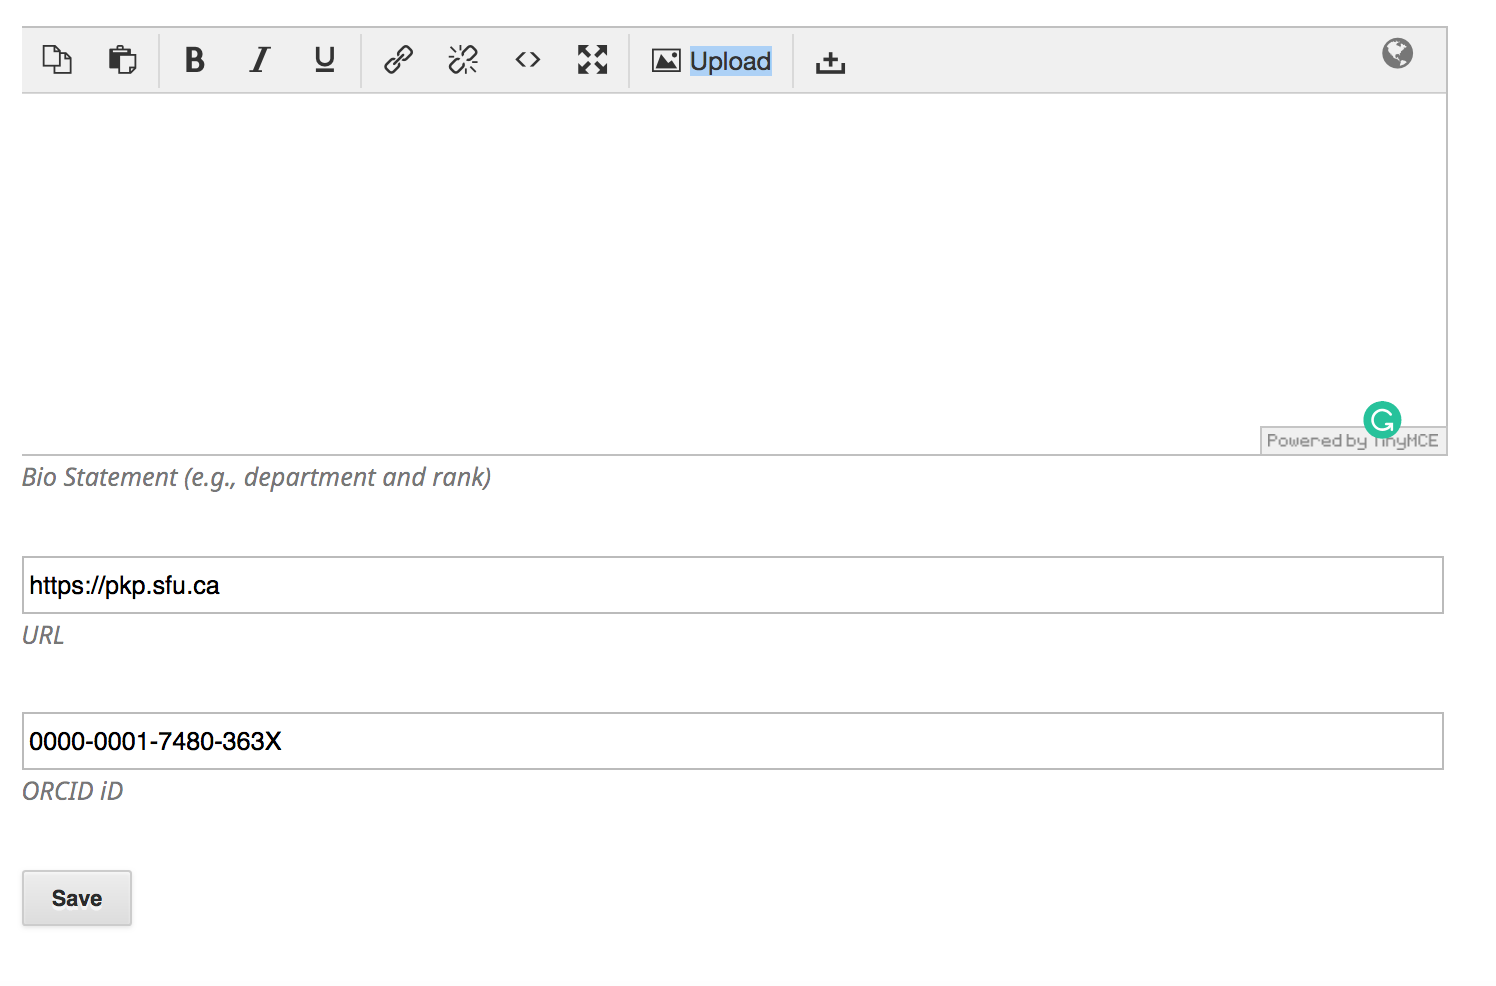
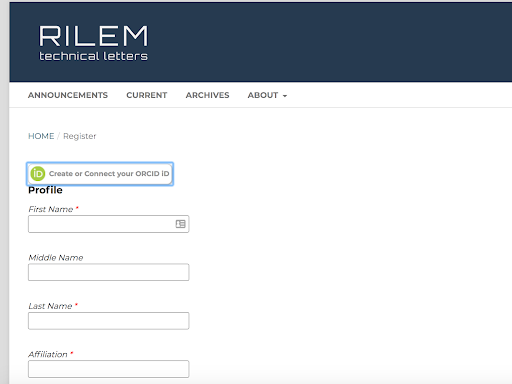
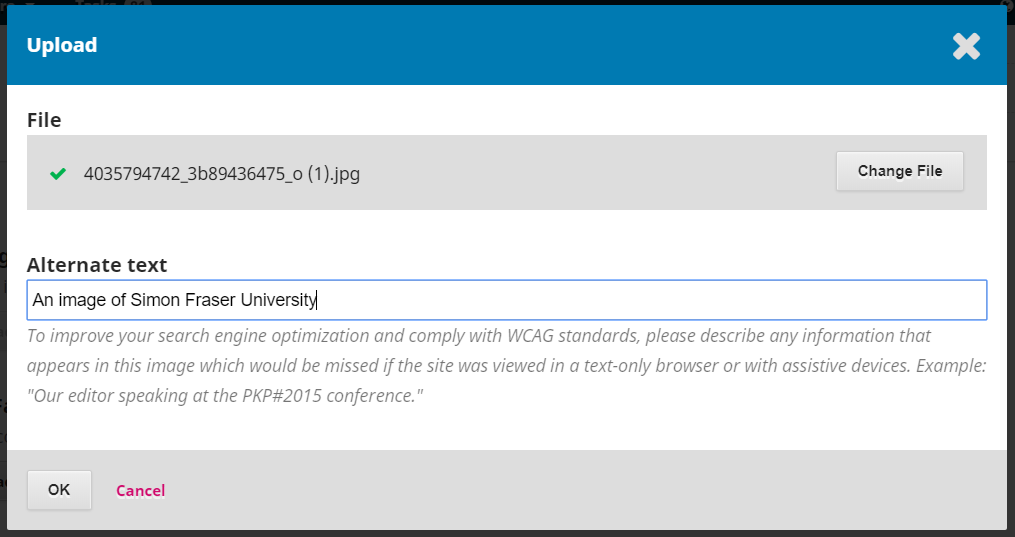
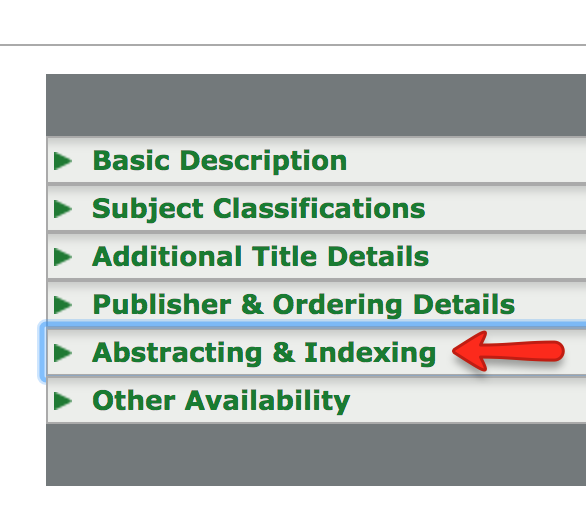 A screenshot from Ulrichs Web Global Serials Directory
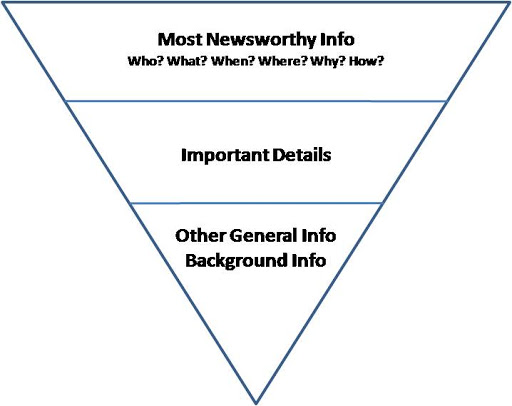


 T. Green