Search This Blog

Sunday, 25 September 2022

Weighted Aggregated Sum Product Assessment


 Source: https://www.iieta.org/journals/mmep/paper/10.18280/mmep.090403

Weighted Aggregated Sum Product Assessment

Shahryar SorooshianNoor Azlinna Azizan Nader Ale Ebrahim 

Department of Business Administration, University of Gothenburg, Gothenburg 41124, Sweden
Prime School of Logistics, Saito University College, Petaling Jaya 46200, Malaysia
Department of Management, Apadana Institute of Higher Education, Shiraz 7187985443, Iran
Corresponding Author Email: 
sorooshian@gmail.com
Page: 
873-878
|
DOI: 
https://doi.org/10.18280/mmep.090403
Received: 
25 May 2022
|
Accepted: 
2 August 2022
|
Published: 
31 August 2022
| Citation

OPEN ACCESS

Abstract: 

Multiple Criteria decision-making (MCDM) approaches are required for complex issue resolution. However, it is debatable whether MCDMs applicability will be able to stay within the analytical possibilities for dealing with divorce issues. As a result, one of the newly introduced MCDMs Weighted aggregated sum product assessment (WASPAS), is chosen for evaluation. Therefore, this study examined 388 documents from archive of the Scopus database. To evaluate the diversity of the technique's application, the data analysis looked at a few bibliometrics measures. So, the publishing hosts and their influence patterns are displayed, the vast majority of the documents were in the fields of engineering and computer science. According to the findings, the WASPAS can deal with variety of problem-solving scenarios. Hence, this work is summed up with the aim of lowering uncertainty among decision-makers and scholars.

Keywords: 

multiple criteria decision-making (MCDM), weighted aggregated sum product assessment (WASPAS), literature analysis

1. Introduction

Multiple Criteria Decision-Making (MCDM) techniques are widely employed in industry and academia. The Weighted Product Model (WPM) and the Weighted Sum Model (WSM) are two of the most common techniques among all MCDMs [1-6]. However, when WASPAS (weighted aggregated sum product assessment) decision-making technique first was suggested in 2012, it was considered to be among the most compelling alternative MCDM techniques because it combines the Weighted Product Model (WPM) and the Weighted Sum Model (WSM) into a single procedure [5, 7].

The WASPAS technique was offered by Zavadskas et al. [6]; and it in successful subset of the recent generation of MCDMs [5, 6, 8]. It is argued that WASPAS' algorithm is simple, and it is capable of producing more accurate decision outcome than classic WSM and WPM techniques [5, 7, 9]. WASPAS has received substantial attention from decision makers from all sorts of backgrounds due to the simplicity of the computing process and the accuracy of the outputs, and it is now widely referenced as an excellent decision support tool [5, 7].

Based on previous practices [10-13], WASPAS's utilization necessitates four following steps for analyses of the data:

(1) Creation of a decision matrix, X=[x(i,j)]mn, where n is the number of criteria, m is the number of alternatives, and xij is the performance of the ith alternative in relation to the jth criterion.

(2) Normalization of all entries in the decision matrix using the following two equations to make the metrics non-dimensional. The formula, where the normalized value of x(i,j) is x´(i,j), for beneficial criteria is x´(i,j)=x(i,j)/maximumi x(i,j) and for non-beneficial criteria it is x´(i,j)=minimumi x(i,j) /x(i,j).

(3) The first relative significance of the ith option, in one hand, is analogous to the WSM technique. The Q(1)i=

 formula is used to compute the overall relative significance of the ith alternative where w(j) is the relative significance (weight) of the jth criteria. The second relative significance of the same ith alternative, in the other hand, is calculated using the WPM approach using the Q(2)i

  formula.

(4) Qi=λQ(1)i+(1 - λ)Q(2)i is a generalized equation established in WASPAS for calculating the total relative significance of ith alternative, where λ is the combination parameter in the range of 0 to 1. WASPAS method is transformed into WPM when the value of λ is 0, and WSM method when it is 1. λ is been used to remedy MCDM issues in ranking accuracy.

A case is borrowed to practice the WASPAS MCDM, referencing an application of WASPAS from a reference [14] and simplified here. In a decision, there are 3 criteria (C1, C2 and C3), the first two of which is beneficial but the second one is cost-related (not beneficial). C1 and C2 are equal important, 25%, but C3 is more important, 50%. Based on MCDM WASPAS, the decision maker has 5 alternatives from which to choose. Their decision matrix in shown via Table 1, as step 1 of WASPAS. Normalization of all entries in the decision matrix in shown in Table 2, as WASPAS step 2.

Multiplying the relative importance of each criterion leads us to the next step of attribute optimization. For one, the first cell followed by WSM approach gives A1 as Q(1)i: =

=(5/5×0.25)+(3/5×0.25)+(8000/8500×0. 50). However WPM approach for A1 gives Q(2)i == (5/50.25) × (3/50.25) × (8000/8500

0. 50). Finally, the last step in WASPAS, after getting Q(1)i and Q(2)i for all alternatives, is finding Qi=λQ(1)i+(1- λ)Q(2)i as ,with decided λ =1/2 , it became (Q(1)i/2)+(Q(2)i /2) for all alternatives. WASPAS results in choosing the best alternatives as shown in Table 3.

Table 1. Decision matrix


C1 (Qualitative weight (1-5))

C2 (Qualitative weight (1-5))

C3 (Cost $)

A1

5

3

8500

A2

5

3

8000

A3

5

5

8500

A4

3

4

8000

A5

5

5

8500

Table 2. Normalized matrix


C1

C2

C3

A1

5/5

3/5

8000/8500

A2

5/5

3/5

8000/8000

A3

5/5

5/5

8000/8500

A4

3/5

4/5

8000/8000

A5

5/5

5/5

8000/8500

Table 3. Ranking of alternatives

WSM

WPM

WASPAS

Ranking

0.870588

0.853834

0.862211


0.9

0.880112

0.890056


0.970588

0.970143

0.970365

Best

0.85

0.832358

0.841179

Worst

0.970588

0.970143

0.970365

Best

WASPAS method has been used in various research projects, however there is no synopsis of its usage yet. This study attempts to fill the literature gap by conducting a WASPAS literature survey.

2. Method

There are two major databases for collecting scholarly publications data, namely Web of Science (WoS) and Scopus [15]. To select the best database for data collection The search formulation of (TITLE-ABS-KEY ("Weighted aggregated sum product assessment") OR TITLE-ABS-KEY ("WASPAS")) was used on 12/4/2022 to search for related terms via titles, abstracts, and keywords. The number of documents retrieved from WoS and SCOPUS databases was 369 and 388 respectively. Therefore, the data used in this study came from the archive of Scopus databases. The data for the last year, 2022, was not complete, because of the search time. Nonetheless, 388 documents, including 326 articles, 48 conference Paper, 8 book chapters, 4 review papers, and 2 conference reviews, were among the results of the data search. Among them, the status of 27 documents was ‘Article in Press’.

There were no limitations in the time frame and search fields. However, the first article in the research area was published in the year 2012. All data were exported to a comma-separated value (CSV) file for further analysis. One document was written in Croatian, and non-English. Thus, it together with two conference reviews were taken out, limiting the analysis to 385 documents. Documents were analyzed based on their type, distribution of subject category, output, authorship, country of publication, publication patterns, and distribution of documents with the Scopus [16] analysis platform. Besides, the latest version of VOSviower [17] software (Version 1.6.18 released in January 2022) was used for detailed bibliometric analysis. VOSviewer was selected as it was solely designed for scientific research, bibliometric maps, and graphical data representation [18]. The VOSviewer software is able to read CSV file which was exported from the Scopus database and analysis them according to some defined analysis like co-authorships networks, and keywords’ co-occurrence. Besides, ScienceScape [19] was used as a supplementary online data visualization tool.

3. Results

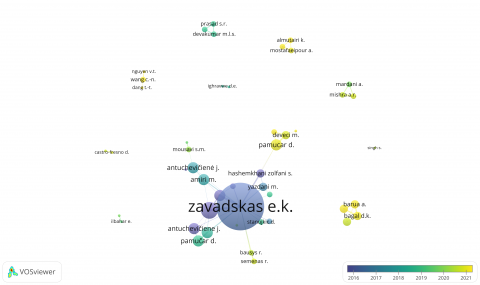
As illustrated in Figure 1, the use of the WASPAS method in scientific documents is steadily expanding year after year, according to Scopus statistics. Among the WASPAS users, Edmundas Kazimieras Zavadskas from Vilnius Gediminas Technical University, who developed the method, was strongly top author listed based on the archived document number, with 11.4 percent of the documents. His university colleague, Jurgita Antucheviciene, was second listed with 3.9 percent of the documents, and another university colleague, Zenonas Turskis, was next with 3.3 percent of the documents.

Figure 1. Documents by year

Using the data of Figure 1, results Figure 2 with a non-linear regression equation based on the Power Model with N publications and A years of method’s age as A=0.03N^3.53; The response variable in a power mode non-linear regression is related to the factor increased to a power [20]. That outcome predicts, for instance, about 400 published documents are likelihood to be archived via Scopus in 2025. Plotting visualization of Figure 2 provides the fitting validation.

Figure 2. Publications prediction

Moreover, as shown in Figure 3, although Zavadskas leads the strongest earliest known network of co-authorship based on the collected documents, recent 2-3 years observed limited but new networks of newcomers. The overlay visualization of a co-authorship network was constructed based on 385 documents. In this visualization, the size of the circle represents the number of documents published. Each colony represents a group of researchers who works and published together.

Figure 3. Overlay visualization of co-authorships

Table 4. Documents by study field

Study Field

Documents

Engineering

171

Computer Science

136

Mathematics

76

Business, Management and Accounting

68

Environmental Science

59

Energy

55

Social Sciences

48

Decision Sciences

41

Materials Science

37

Economics, Econometrics and Finance

26

Physics and Astronomy

26

Chemistry

15

Chemical Engineering

13

Earth and Planetary Sciences

9

Multidisciplinary

5

Agricultural and Biological Sciences

4

Medicine

4

Biochemistry, Genetics and Molecular Biology

3

Arts and Humanities

2

Health Professions

1

Neuroscience

1

Psychology

1

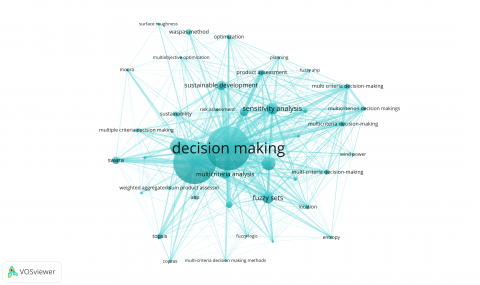
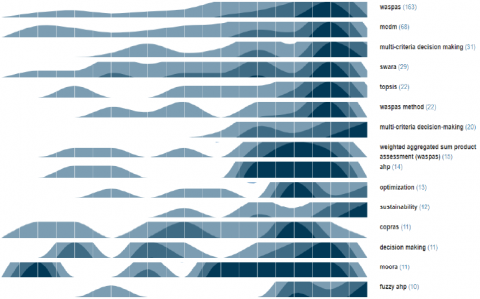
Figure 4 depicts an inference that demonstrates the capability of the WASPAS method to be used in conjunction with other MCDM methods such as AHP, TOPSIS, Entropy, SWARA, MOORA, COPRAS, as well as fuzzy sets and sensitivity analysis. It also shows the method’s applicability in various study areas such as risk management, sustainability research, location decisions, and wind power-related works. Furthermore, as illustrated in Figure 5, the variety of applications of the WASPAS decision-making method in diverse fields has grown in recent years.

In Figure 5, The density of utilized keywords over time is represented by color themes ranging from bright to dark, similar to a standard heat-maps. More to be discussed, even though the WASPAS method was created for decision-makers and based on applied mathematics, engineering and computer science are two of the method's most prominent users, accounting for 80 percent of the documents. Table 4 shows the distribution of the documents by study field. In addition, the statistics in this table demonstrates the method's broad applicability across more than 20 different fields.

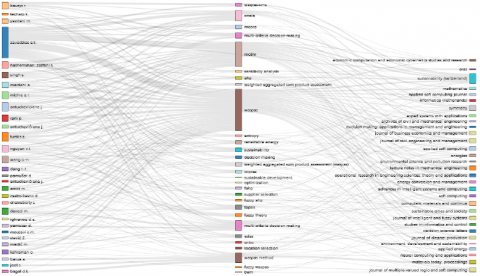
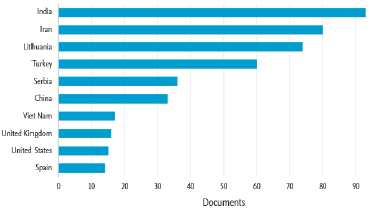
Figure 6 looks at the top authors, keywords, and publishing journals and how they are linked. Figure 7, however, depicts the top ten countries with the most archived documents, and as can be seen, India dominates with nearly one-fourth of the count, followed by Iran. However, according to the data, some important scholarly actors, such as Japan, Austria, Finland, Norway, Vietnam, Ukraine, and a few others, are not yet WASPAS users.

Figure 4. Network visualization of Keywords

Figure 5. Keywords Evolution over time

Figure 6. Authors, keywords, and journals

Figure 7. Documents by country

4. Conclusions

The purpose of this study was to give insight into the deployment of WASPAS. The research conducted an examination of the Scopus database, as well as the requisite bibliometric analyses. While this review is coming to an end, it has the potential to increase the conceptual productivity of the WASPAS by carefully assessing the elements, evaluating current bibliometric information, and comprehending the different motivations for the method's diverse usage. WASPAS is capable to solve MCDMs in variety of fields, especially in engineering and computer science context. The readers acquire a plausible view after gaining a thorough grasp of solicitation and the execution of the WASPAS.

Acknowledgment

The publication fee of this work is supported by Prince Sultan University.

  References

[1] Budiharjo, A.P.W., Muhammad, A. (2017). Comparison of weighted sum model and multi attribute decision making weighted product methods in selecting the best elementary school in Indonesia. International Journal of Software Engineering and Its Applications, 11(4): 69-90. https://doi.org/10.14257/IJSEIA.2017.11.4.06

[2] Maliene, V., Dixon-Gough, R., Malys, N. (2018). Dispersion of relative importance values contributes to the ranking uncertainty: Sensitivity analysis of multiple criteria decision-making methods. Applied Soft Computing, 67: 286-298. https://doi.org/10.1016/j.asoc.2018.03.003

[3] Chourabi, Z., Khedher, F., Babay, A., Cheikhrouhou, M. (2019). Multi-criteria decision making in workforce choice using AHP, WSM and WPM. The Journal of The Textile Institute, 110(7): 1092-1101. https://doi.org/10.1080/00405000.2018.1541434

[4] Zavadskas, E.K., Antucheviciene, J., Hajiagha, S.H.R., Hashemi, S.S. (2014). Extension of weighted aggregated sum product assessment with interval-valued intuitionistic fuzzy numbers (WASPAS-IVIF). Applied Soft Computing, 24: 1013-1021. https://doi.org/10.1016/j.asoc.2014.08.031

[5] Alam, K.A., Ahmed, R., Butt, F.S., Kim, S.G., Ko, K.M. (2018). An uncertainty-aware integrated fuzzy AHP-WASPAS model to evaluate public cloud computing services. Procedia Computer Science, 130: 504-509. https://doi.org/10.1016/j.procs.2018.04.068

[6] Zavadskas, E.K., Turskis, Z., Antucheviciene, J., Zakarevicius, A. (2012). Optimization of weighted aggregated sum product assessment. Elektronika ir elektrotechnika, 122(6): 3-6.

[7] Mardani, A., Nilashi, M., Zakuan, N., Loganathan, N., Soheilirad, S., Saman, M.Z.M., Ibrahim, O. (2017). A systematic review and meta-Analysis of SWARA and WASPAS methods: Theory and applications with recent fuzzy developments. Applied Soft Computing, 57: 265-292. https://doi.org/10.1016/j.asoc.2017.03.045

[8] Chakraborty, S., Zavadskas, E.K. (2014). Applications of WASPAS method in manufacturing decision making. Informatica, 25(1): 1-20.

[9] Senapati, T., Chen, G. (2022). Picture fuzzy WASPAS technique and its application in multi-criteria decision-making. Soft Computing, 26(9): 4413-4421. https://doi.org/10.1007/s00500-022-06835-0

[10] Baykasoğlu, A., Gölcük, İ. (2019). Revisiting ranking accuracy within WASPAS method. Kybernetes, 49(3): 885-895. https://doi.org/10.1108/K-01-2019-0052

[11] Chakraborty, S., Zavadskas, E.K., Antucheviciene, J. (2015). Applications of WASPAS method as a multi-criteria decision-making tool. Economic Computation and Economic Cybernetics Studies and Research, 49(1): 5-22.

[12] Saraswat, S.K., Digalwar, A.K., Yadav, S.S. (2021). Sustainability assessment of renewable and conventional energy sources in India using fuzzy integrated AHP-WASPAS approach. Journal of Multiple-Valued Logic & Soft Computing, 37(3): 335-362.

[13] Klumbytė, E., Bliūdžius, R., Medineckienė, M., Fokaides, P.A. (2021). An MCDM model for sustainable decision-making in municipal residential buildings facilities management. Sustainability, 13(5): 2820. https://doi.org/10.3390/su13052820

[14] Tundo, T., Kurniawan, D. (2019). Implementation of the weighted aggregated sum product assessment method in determining the best rice for serabi cake making. International Journal on Informatics for Development, 8(1): 40-46. https://doi.org/10.14421/ijid.2019.08107

[15] Chadegani, A.A., Salehi, H., Yunus, M.M., Farhadi, H., Fooladi, M., Farhadi, M., Ebrahim, N.A. (2013). A comparison between two main academic literature collections: Web of Science and Scopus databases. arXiv preprint arXiv:1305.0377. https://arxiv.org/abs/1305.0377.

[16] https://www.scopus.com/, accessed on Apr. 12, 2022.

[17] https://www.vosviewer.com/, accessed on Apr. 12, 2022.

[18] Van Eck, N., Waltman, L. (2010). Software survey: VOSviewer, a computer program for bibliometric mapping. Scientometrics, 84(2): 523-538. https://doi.org/10.1007/s11192-009-0146-3

[19] https://medialab.github.io/sciencescape/, accessed on Apr. 12, 2022.

[20] Benestad, C., High, J., Worcester, M. Regression Analysis. https://users.wpi.edu/~goulet/MME523/chris_b.htm.


Wednesday, 21 September 2022

کارگاه آشنایی با افزایش رویت پذیری و اثرگذاری تحقیقات

 Source: https://jtehran.com/classroom/2444

کارگاه آشنایی با افزایش رویت پذیری و اثرگذاری تحقیقات

  
مدت دوره:
2 ساعت
تعداد جلسات:
1 جلسه
روزهای برگزاری:
دوشنبه
زمان برگزاری:
09:00 الی 11:00
مهلت ثبت نام: 1401/08/05 - 9:30
فرصت باقیمانده ثبت نام:

35 روز 12 ساعت 5 دقیقه 4 ثانیه

تاریخ شروع: 1401/08/05
تاریخ پایان: 1401/08/05
قیمت دوره: 200,000 تومان

عنوان دوره: کارگاه آشنایی با افزایش رویت پذیری و اثرگذاری تحقیقات

مدت دوره (ساعت): 2 ساعت

روزهای برگزاری: پنج شنبه

ساعت برگزاری: 9 تا 11

تاریخ شروع دوره: 5 آبان ماه 1401

مدرس: دکتر نادر آل ابراهیم

پیش نیاز:

این کارگاه پیش نیاز ندارد اما داشتن حداقل یک مقاله در ژورنالهای معتبر ایندکس شده در اسکوپوس  (SCOPUS) یا وب آف ساینس (معروف به آی اس آی) (Web of Science) می تواند باعث بهره برداری بیشتر شرکت کنندگان شود.

دوره ویژه چه کسانی است؟

سیاست‌گذاران دانشگاه، محققین،اساتید، و دانشجویان دوره تحصیلات تکمیلی که تمایل به ارتقاء رتبه علمی خود و دانشگاه را دارند، مخاطبین اصلی این دوره می‌باشند. علی الخصوص محققانی که حداقل یک مقاله معتبر در نشریات بین المللی چاپ نموده‌اند و تا کنون استناد مورد انتظار را دریافت ننموده‌اند.

معرفی دوره:

طبق مقاله ای که در مجله نیچر (Nature) در سال 2014 منتشر شده ،(nature.com/top100, 2014)، بیش از 43% از مقالاتی که در نشریات ایندکس شده در وب آف ساینس (Web of Science) به چاپ رسیده هرگز مورد استناد قرار نگرفته‌اند. بطور قطع کیفیت مقالات دلیلی بر بی‌توجهی سایر محققین نبوده، بلکه عدم اطلاع از وجود چنین مقالاتی؛ علت اصلی عدم استنادات بوده است. چاپ یک مقاله در یک نشریه معتبر علمی تنها نیمی از راه نشر آن است، بخش اعظمی از فرآیند نشر مقاله، مربوط به رویت‌ پذیری آن مقاله می باشد. استفاده از ابزارهای پژوهشی مناسب می تواند به محقق کمک کند تا نتیجه کار خود را در دسترس سایرین قرار داده و در نهایت، مقاله‌اش استنادات مناسبی بگیرد. سهم استناد به مقالات تاثیر شگرفی در رتبه‌بندی محققین و دانشگاه‌ها دارد. بنابراین با افزایش اثرگذاری مقالات به ارتقا رتبه علمی فرد و دانشگاه کمک شایانی خواهد شد.

در کارگاه آشنایی با افزایش رویت پذیری و اثرگذاری تحقیقات، محققین با ضرورت افزایش رویت پذیری آشنا و قادر خواهند بود تا میزان رویت پذیری کارهای تحقیقاتی خود را اندازه گیری و نقاط ضعف احتمالی را کشف و جهت رفع آن اقدام نمایند.

در باره مدرس دوره:

دکتر نادر آل ابراهیم مشاور ارشد در حوزه افزایش رویت پذیری و ضریب تاثیر تحقیقات و مدرس مهارت های پژوهشی در سطح ایران و بین المللی می باشد. دکتر نادر آل ابراهیم اکنون بعنوان مشاور ارشد در حوزه افزایش رویت پذیری و ضریب تاثیر تحقیقات مشغول به فعالیت می باشد. ایشان همچنین بعنوان استاد مدعو دروس مهارتهای پژوهشی را برای دانشجویان دوره دکتری ارائه می نمایند. دکتر آل ابراهیم دکتری خود را درسال 2012 از دانشگاه مالایا (University of Malaya) کشور مالزی در رشته مدیریت تکنولوژی اخذ نموده و پس از آن حدود پنج سال به عنوان هیئت علمی این دانشگاه مشغول تدریس بوده و همزمان با مرکز خدمات پشتیبانی محققین، در حوزه افزایش رتبه دانشگاه فعالیت می نمودند. ایشان علاقه مند به تحقیق در زمینه مهارتهای الکترونیکی، ابزارهای پژوهشی، علم سنجی، رتبه بندی دانشگاه ها، و تیم های مجازی تحقیق و توسعه برای تولید محصول جدید می باشد.

دکتر آل ابراهیم بعنوان مبدع Research tools  و توسعه دهنده ابزارهای بازارسازی تحقیقات علمی در منطقه شرق آسیا شناخته شده است. استفاده از Research tools  به محققین کمک می نماید تا در زمان کوتاه تر و با دقت بیشتر مستندات علمی را تامین؛ تولید؛ چاپ و در نهایت به رویت همگان برسانند تا از این رهگذر حداکثر استنادات ممکن را جذب نمایند.

دکتر آل ابراهیم تا کنون بیش از یکصد مقاله در نشریات و کنفرانسهای بین المللی ارائه کرده است و یکی از نویسندگان کتاب “مدیریت و راهبری دانشگاههای خلاق” بوده است. وی تا کنون صدها کارگاه آموزشی بصورت حضوری و آنلاین در کشورهای مختلف مانند مالزی، عراق، ویتنام، عمان، آفریقای جنوبی، کرواسی، آلمان، ترکیه، پاکستان و هندوستان برگزار نموده است.